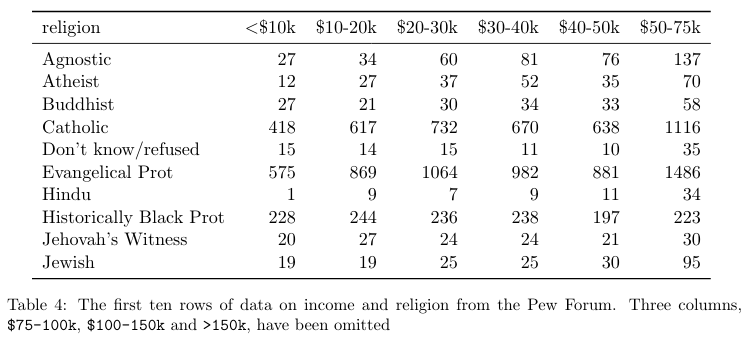
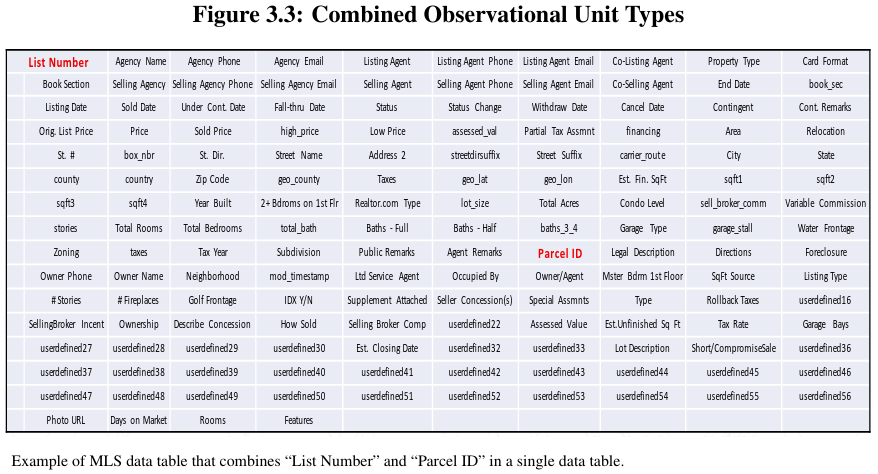
Data Structure

Is the data appropriately structured for purposes of analysis?

Because datasets are often created for reasons of administration and reporting, and further that there are generally few constraints on their organization, administrative datasets are often constructed in manners not conducive to statistical analyses. During the data profiling step, issues about data structure are identified. During the data transformation step decisions on how to restructure data are made and executed. An example from the housing case study is given in Figure \ref{MLScombine}. The dataset provided was comprised of single records with 128 fields. All fields in the record were keyed to the variable``List Number.'' Structured this way, it is not possible to analyze property changes over time, even though the data does in fact exist within the dataset. That is, a restructuring is necessary that pulls out and re-relates the property information to a different key (here, Parcel ID). This situation occurs often as a result of the structural issue 'combined observational unit types' discussed below. \begin{figure}[h!] \centerline{\includegraphics[scale=.6]{CombinedTypes.pdf}} \caption{Combined data types of \textit{List Number} and \textbf{Parcel ID} from MLS data table.} \label{MLScombine} \end{figure}

Missing Variables

‘Missing variables’ means that a dataset has values in column headers instead of variable names. It is not uncommon to receive tabular datasets that have been designed for the purpose of presentation, not analysis, where variables form both the rows and columns, and column headers are values, not variable names. While this type of structural issue was not experienced with the datasets under consideration, it is an issue to be cognizant of, especially, as our experience indicates, when dealing with agency datasets released as tabular data in spreadsheet files. Such files are often initially produced for the purpose of conveying aggregated summary data to decision-makers and are not constructed like a traditional dataset (i.e. one record per row with clear field/column titles).

Combined Variables

Combined variables refers to the condition where more than one variable is represented in a record field. Sometimes, especially, after some form of correction to the previous problem of missing variables has been address, we end up with column variable names comprised of a combination of multiple underlying variable names. It should be note that many times, like duplication, this is an issue of problem definition. A common example with administrative record files occurs when we use parts of the date_of_birth field. For example, in the education case study, there was a need at one point to categorize students by birth_year. To achieve this categorization, it was first necessary to divide out from the date_of_birth field the variables birth_month, birth_day, and birth_year. While this is often achieved within the programming of a query (i.e. select datepart(‘year’, date_of_birth), what in fact is occurring is the separation of previously combined variables.

Here is an example that combines gender and age group in the same variable:

Multiple Observation Directions

A particularly messy structural issue occurs when a dataset has variable names in both columns and rows. For example, a dataset with an field/column for each day of the month (on the horizontal) and a row title for ‘month’ (on the vertical). This situation occurs most often when the data provided comes in the form of and cross-tabulated aggregate data.

Table 11 shows daily weather data from the Global Historical Climatology Networkfor one weather station (MX17004) in Mexico for five months in 2010. It has variables in individual columns (id,year,month), spread across columns (day, d1-d31) and across rows(tmin,tmax) (minimum and maximum temperature).

Combined Observational Unit Types

Within administrative records, multiple types of data are often combined for expediency. By multiple types we mean different sets of data fields, each set representing a different type of observational unit (e.g. property information and listing agent information in the same record). The observational unit types necessary to the project at hand need to be separated out into individual observations or individual datasets in the restructuring phase.

One example encountered in the education case study had to do with a dataset containing both individual demographic data and a periodic measurement of weekly attendance where demographic data and weekly attendance are separate observational units and needed to be in separate datasets for the purposes of the study.

An example from the housing case study is given in Figure 3.3. The dataset provided wascomprised of single records with 128 fields. Each original record was identified by a unique“List Number.” However, if a parcel was listed twice it would have two different “List Num-bers.” As a result, changes in a property or parcel over time could not be tracked from theserecords because the structure only identified the list number not the parcel number. Changingthe structure to include the “Parcel ID” allowed the required historical tracking of changes.

Divided Observation Unit Type

Within administrative data systems, it is also not uncommon to find that a single observation unit type has been split among multiple datasets.This is similar to the consistency discussion of multiple observations with overlapping demographic information. The difference here is that you may have information split among several datasets. For example, there may be, as was the case with one state’s educational records, separate tables that duplicate the collection of student demographics. Figure \ref{dividedtype} captures gender mismatches across two tables from the same education record information system, linked on the Unique Id of the student. Decisions on whether and how to transform inconsistent data as a result of divided observation unit type need to factor in the magnitude of the issue as well as the ability to accurately correct the data in a timely enough fashion given the project at hand.

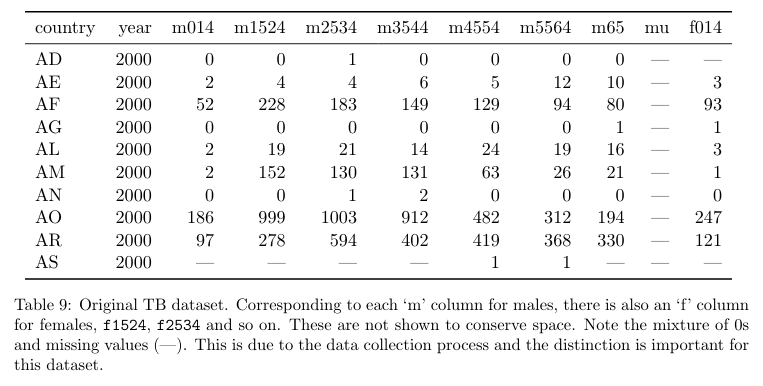
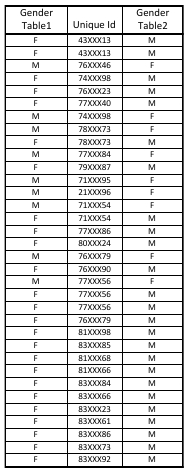
Example of divided observational units for gender mismatched in multiple tables.

Many Problems Real-Life Example

Scraping data from an emergency services online data system: