Introduction
This article walks through the standard workflow: take a long-format dataset
covering years before and after the 2020 census, and produce a unified frame
where every pre-2020 sub-county measure exists in both its original 2010
boundary form (_geo10 suffix) and a redistributed 2020 boundary form
(_geo20 suffix).
Input format
standardize_all expects an SDC long-format DataFrame:
| column | type | description |
|---|---|---|
geoid |
str | 11-char tract or 12-char block-group GEOID |
year |
int | observation year |
measure |
str | measure name (e.g. "material_deprivation") |
value |
float | measure value |
moe |
float | margin of error (may be pd.NA) |
region_type |
str | optional; "tract" or "block_group" |
Example
import pandas as pd
from sdc_census10to20 import standardize_all

df = pd.DataFrame(
    {
        "geoid":   ["51059450100", "51059450200", "51059450100"],
        "year":    [2018,          2018,          2020         ],
        "measure": ["population",  "population",  "population" ],
        "value":   [3000.0,        4500.0,        3100.0       ],
        "moe":     [pd.NA,         pd.NA,         pd.NA        ],
        "region_type": ["tract",   "tract",       "tract"      ],
    }
)

standardized = standardize_all(df)
The 2018 rows are duplicated: once as population_geo10 (original boundaries)
and once as population_geo20 (redistributed onto 2020 boundaries). The 2020
row is emitted as population_geo20 only.
What "redistribute" actually does
For each pre-2020 row, standardize_all calls
convert_2010_to_2020_bounds,
which:
- Loads the Census 2010↔2020 relationship file for the appropriate resolution (tract or block group).
- Classifies each row of the crosswalk as
same,split, ormovedbased on counts and area overlap. - Distributes each 2010 tract's value to the overlapping 2020 tracts in
proportion to the share of the 2010 source area in each overlap
(
area_part / area10).
Because a source tract's overlaps tile it, the shares sum to 1 and the total is conserved — a county's population is unchanged by reprojection onto 2020 boundaries (its county boundary didn't move). This is count-preserving areal interpolation. For rates and indices, redistribute the numerator and denominator separately and recompute the ratio at the 2020 level.
Working with a single year/measure
If you have just one slice and want to redistribute it directly without the suffix logic:
from sdc_census10to20 import convert_2010_to_2020_bounds

slice_df = df[(df["year"] == 2018) & (df["measure"] == "population")]
on_2020_bounds = convert_2010_to_2020_bounds(slice_df)
The input must contain one row per GEOID; if you have multiple years or
measures, slice first or use standardize_all.
Inspecting the crosswalk
To examine the underlying 2010↔2020 mapping:
from sdc_census10to20 import get_2010_2020_bound_changes

cw = get_2010_2020_bound_changes(res="tract", geoids=["51059450100"])
print(cw)
type_change will tell you which case applies for each pairing.
Visualizing a boundary change
convert_2010_to_2020_bounds redistributes a complete 2010-boundary dataset onto
2020 tract boundaries (area-weighted for tracts that were redrawn). Montgomery
County, VA had its tracts redrawn between 2010 and 2020 — 16 tracts became 23,
several splitting into smaller pieces — while the county boundary stayed put. Here
every 2010 tract gets a synthetic population, and we convert the whole county at
once. The tract geometries ship with this page.
import geopandas as gpd
import numpy as np
import pandas as pd
from sdc_census10to20 import convert_2010_to_2020_bounds

tracts_2010 = gpd.read_file("tracts_2010.geojson").sort_values("geoid").reset_index(drop=True)

# Synthetic 2010 populations (one row per 2010 tract).
rng = np.random.default_rng(0)
data = pd.DataFrame({"geoid": tracts_2010["geoid"], "value": rng.integers(800, 5000, len(tracts_2010)).astype(float)})

# Convert the whole county onto 2020 boundaries (fetches the Census crosswalk).
out = convert_2010_to_2020_bounds(data, state_fips="51")
print("2010 total:", data["value"].sum(), " 2020 total:", round(out["value"].sum(), 1))
print(out.head().to_string(index=False))
2010 total: 46688.0  2020 total: 46688.0
      geoid       value
51063920104   20.237667
51121020100 4372.473878
51121020201 3475.000000
51121020202 2946.373028
51121020301  126.482992
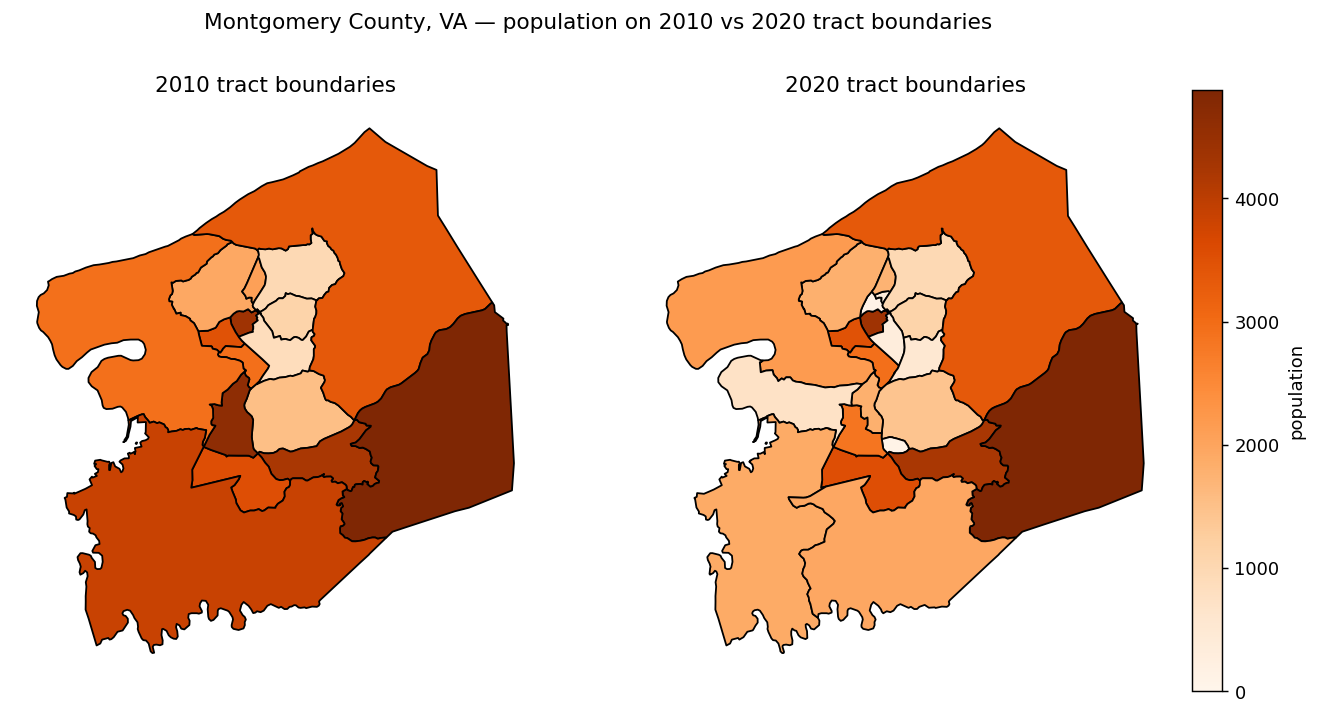
The same 46,688 people, redistributed onto the redrawn 2020 tracts. The total is
preserved — each 2010 tract's count is split among the 2020 tracts that
replaced it in proportion to shared area, so a county's population is unchanged by
the reprojection. (A tiny amount lands in a neighboring county where a 2010 tract
straddled the county line — 51063920104 above.)
convert_2010_to_2020_boundsdownloads the Census 2010↔2020 relationship file, so this example needs network access.