Data Profiling

Data profiling starts with a determination of both the quality of the data and its utility to the project at hand. There are numerous rubrics available, but a useful initial assessment of data quality can be achieved through statistical analysis of data field completeness, data field value correctness, and logical consistency between fields and between records {\color{green}{(Redman, Wang, DOD, others)}}. In addition, it is useful to ascertain the spread of unique values within a field, as well as the rate of duplication at the record level. For an assessment of dataset utility, the dataset's structure should be analyzed. This is to determine how well the dataset has been structured for the purposes of the intended analyses. The the state of the dataset's metadata should also be analyzed to determine how well observational units and their attributes are defined. An important feature of the data profiling process is that discovered issues are only described and not actually “fixed”. The appropriate fix will depend upon the specific needs of the research. If the prescribed "fix" is not appropriate or even possible there would be no need for any action and attempting a fix at this stage could result in wasted time and effort. For example, it may be appropriate to simply normalize city zoning entries into Residential or non-residential versus painfully re-categorizing every missing entry into the 38 zoning classfication.

Data Quality

Does the data correctly represent the real-world construct to which it refers?

A considerable amount of data quality research involves investigating and describing various categories of desirable attributes (or dimensions) of data. These lists commonly include accuracy, correctness, currency, completeness and relevance, as described in Chapter 2. Nearly 200 such terms have been identified and there is little agreement in their nature (are these concepts, goals or criteria?), their definitions or measures (Wang et al., 1993). Here we have let a typology emerge form the project data work. This typology consists of five data quality areas: completeness, value validity, consistency, uniqueness, and duplication. Regardless the typology chosen, the final judgment of data quality is measured by adherence of a dataset to a set of data quality rules. Like data quality attributes, these rules can take one of several forms. Here we choose a typology consisting of three rule-types employed by the DoD in its data quality management efforts. These are: null constraint rules, domain validation rules, and relationship validation rules. Code is developed to enforce these rules. For our study, examples are given in psuedo-code:

Null Constraintsselect sqft from housing where sqft = 0 or sqft = '' or sqrt = NULL
Domain Validation select yearbuilt from housing where yearbuilt is between 1920 and 2015
Relationship Validationselect all from housing where type = multifamily and numunits greater than 1

Completeness

The concept of data completeness can be generalized as the proportion of data provided versus the proportion of data required. Data that is missing may additionally be categorized as record fields not containing data, records not containing necessary fields, or datasets not containing the requisite records. The most common conceptualization of completeness is the first, record field not containing data. This conceptualization of data completeness can be thought of as the proportion of the data that has values to the proportion of data that ’should’ have values. That is, a set of data is complete with respect to a given purpose if the set contains all the relevant data for that purpose. Completeness is application specific. It would be incorrect to simply measure the number of missing field values in a record without first considering which of the fields are actually necessary for completion of the task at hand.

For example, in our study of Multiple Listing Service Real Estate (MLS) data, a datset was provided with each record containing 128 fields. Per record, many of these fields are missing data, however, most of these fields were not important to the purpose of the study (e.g. Listing Agent, Owner Name, Owner Phone). It would not be helpful to categorize the proportion of missing values for these fields. Instead, a decision must first be made as to which fields belong in the analysis for the current purpose. An example pseudo-code would look something like:

for each field in (select needed_field_1, needed_field_2, needed_field_3)
count needed_field_n where
needed_field_n DOES NOT EQUAL 0
and needed_field_n IS NOT BLANK
and needed_field_n IS NOT NULL

Value Validity

The concept of value validity can be conceptualized as the percentage of elements whose attributes possess expected values. The actualization of this concept generally comes in the form of straight-forward domain constraint rules. For example, to ascertain how many entries contain non-valid values for a non-empty text field representing gender, an example pseudo-code domain \textit{comparison-constraint rule} would look something like:

count gender where gender is not in (male, female)

Or, to ascertain how many entries contain non-valid values for a non-empty integer field representing age, a pseudo-code domain \textit{interval-constraint rule} would look something like:

count age where age is not between [0,110]

It should be noted that in many discussions of data quality, this concept is simply referred to as “Validity” (Redman, DoD, …). However, the term validity has many differing and complex meanings (and attendant sub-definitions) within the social and behavioral sciences. Therefore, here we use our own sub-definition “value validity” to be clear which specific form of validity is being discussed.

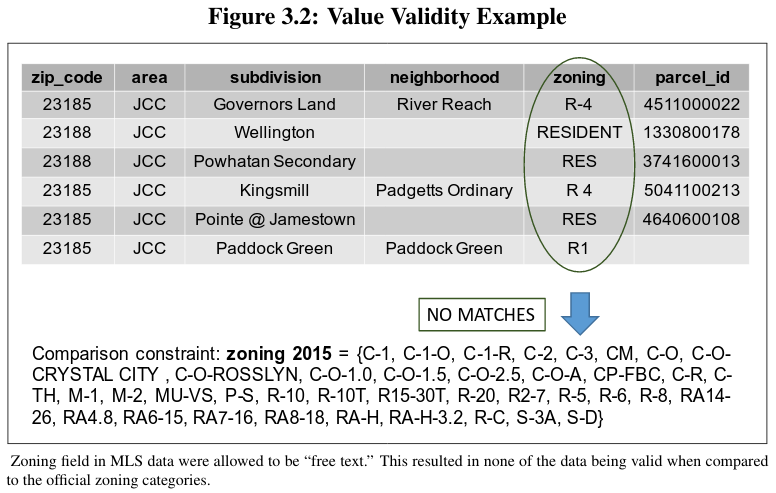
An example of a discovered value validity problem can be seen in Figure 3.2. While profiling MLS data for a particular locality, it was discovered that the values entered for the field “zoning” were extensively varied. It is clear that the mechanism of input provided for this field was ‘free text’ where anything can be typed. The domain comparison-constraint for this field is the official list of zoning district names for that locality. It was found that none of the entries for this field in this particular dataset qualify as valid values. However, it should be noted that there may still vary well be usable information contained within the zoning field. The lack of valid values simply points to a potential problem in need of further investigation. For example, if the question at hand simply requires a count of how many properties are “Resdiential”, it may very well be possible to transform the existing entries to adequately represent a true or false in this respect. However, the executions of such transformations are left for the Data Transformation stage.

Consistency

Record Consistency The concept of record consistency is best understood as the degree of logical agreement “between” record field values in either a single dataset or between two or more datasets. When there is an expected logical relationship between two or more entities, we can refer to the rule specificying this logic as a type of relationship validation called a dependency constraint. Therefore, consistency becomes the degree to which these attributes satisfy said dependency constraint. An example of a logical requirement is that fields A and B must sum to field C. Logical requirements may be quite involved. For example, ‘A has two children’, ‘A is B’s father’, ‘A is C’s father’, and ‘A is D’s father’ are inconsistent.

A simple example of a record inconsistency would be a location disagreement like a zip-code that does not agree with a state code. Another might be the identification of a male who is also pregnant.

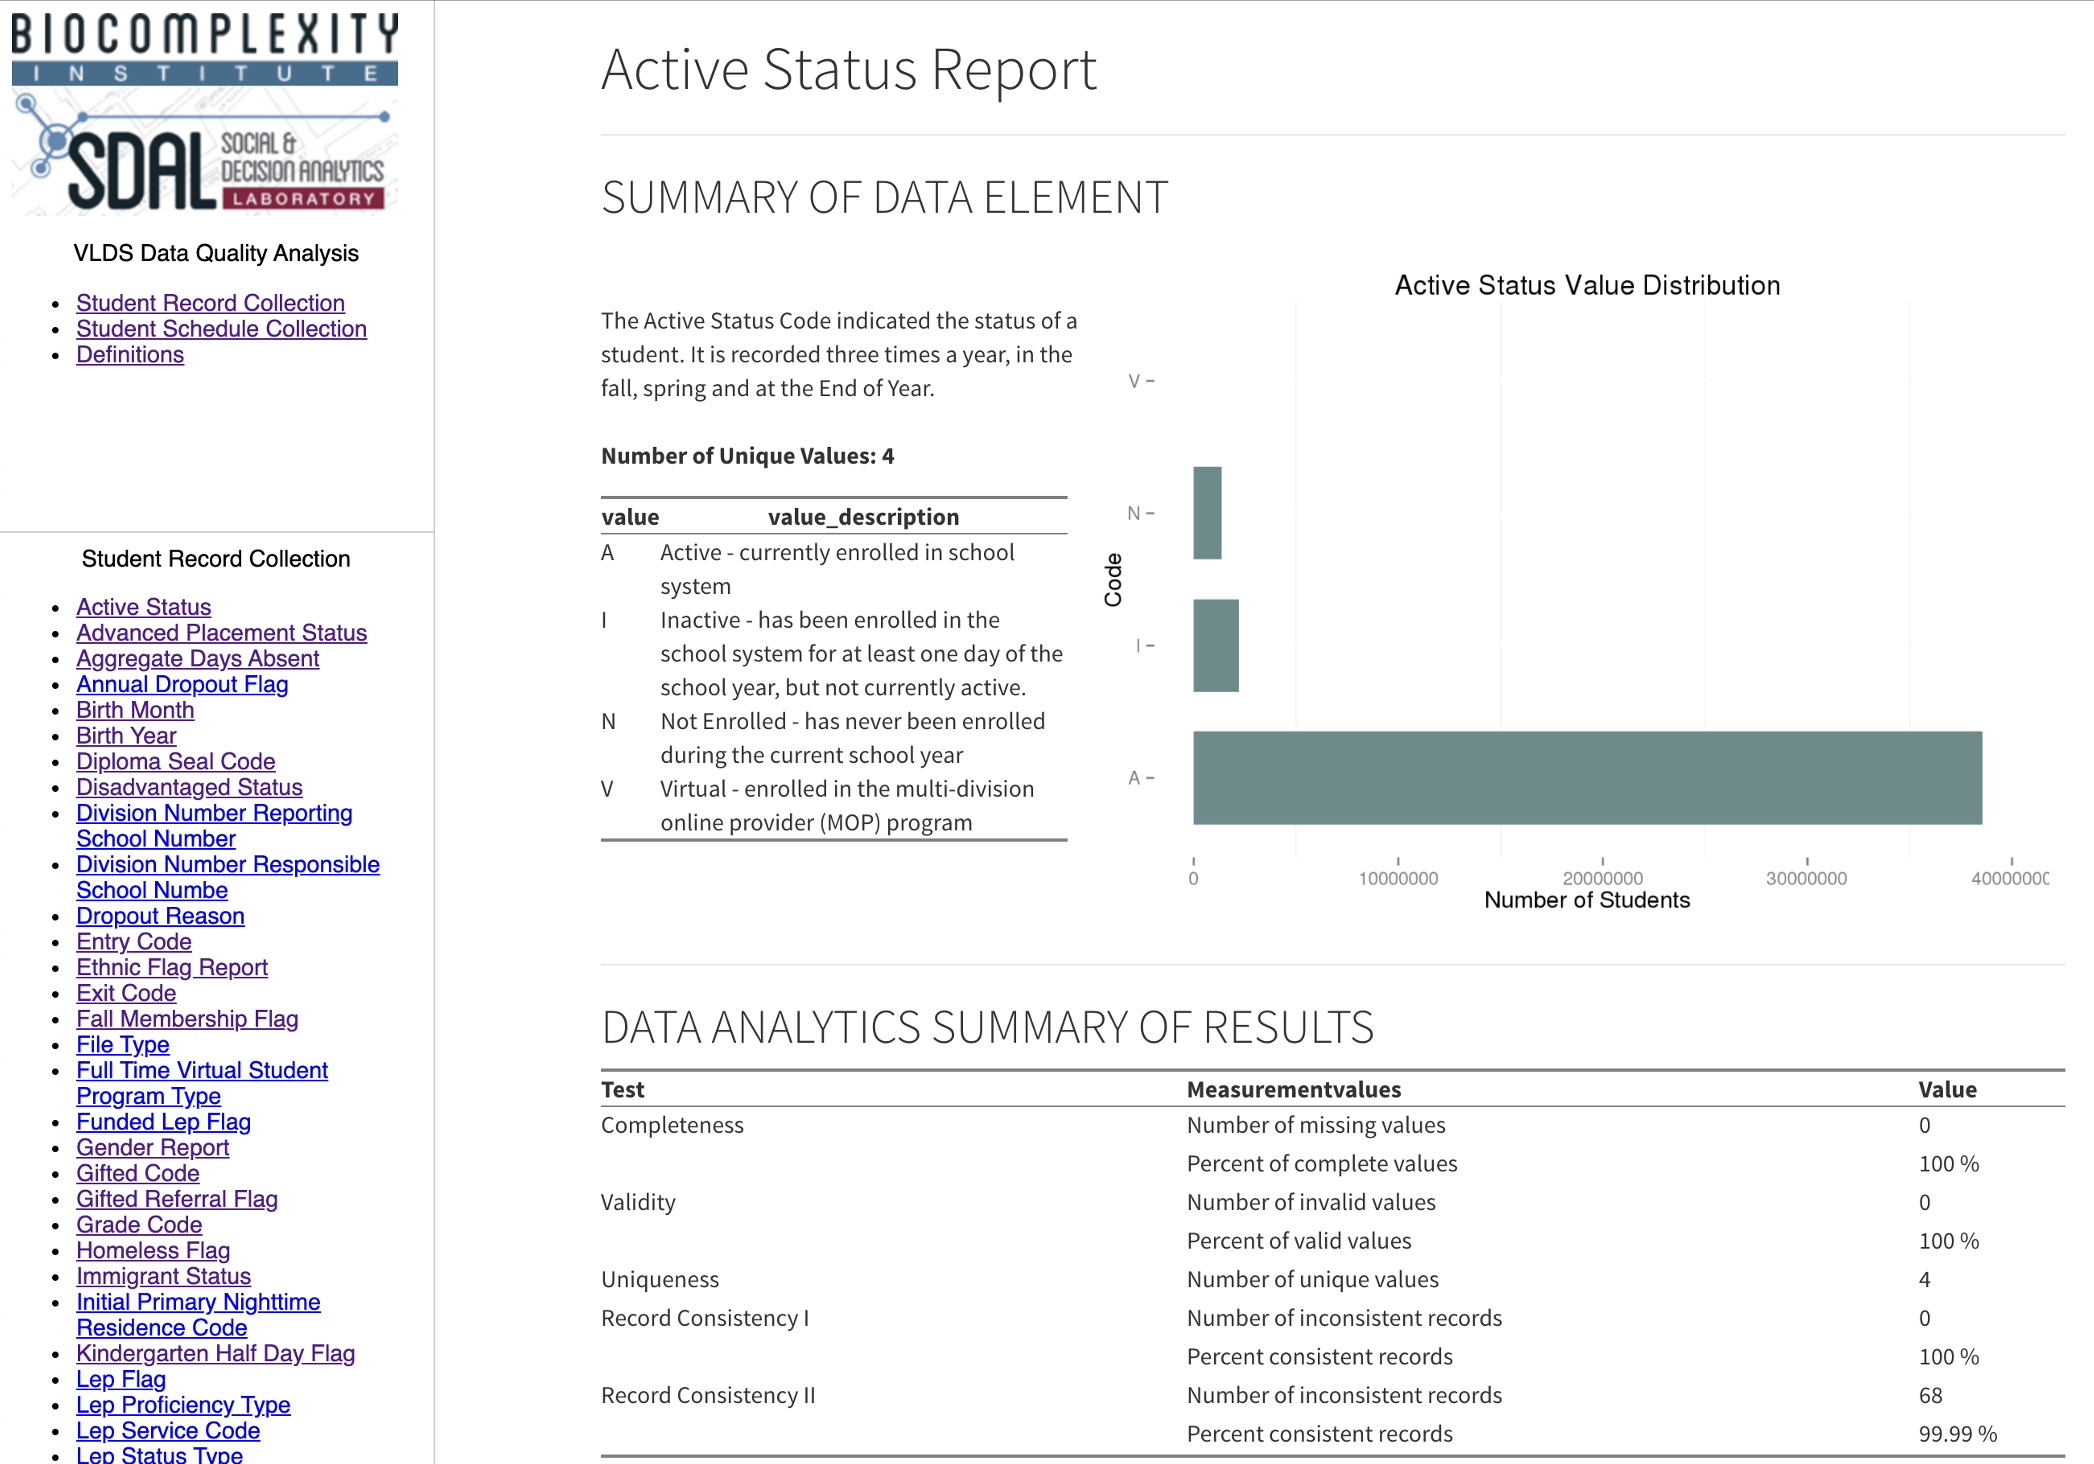
A more complex example would involve consistency validation of fields associated with student withdrawal in education records. For example, most education records contain some form of an ‘active code’ categorizing the student’s current form of interaction with the educational system. Most systems will have a code for ‘Inactive’ and/or ‘Not enrolled’. Most systems will also have a field for withdrawal date. If a student has been categorized as ‘Inactive’ or ‘Not enrolled’ but does not have an entry for withdrawal date, then there exists a record consistency issue.

Checking for records with inconsistent relationship between active_status and exit_code and exit_date

SELECT unique_id, school_year, division_number__serving_school_number
FROM student_mobility_fields_2005_2015
WHERE active_status = 'I'
AND exit_code IS NULL AND exit_date IS NULL

Longitudinal Consistency An inconsistency in the data when checked over time (longitudinally), to see if the same value is recorded for every new record when it should be (i.e. birthdate and other demographics).

Causes of longitudinal inconsistency are varied, but a common source of inconsistency comes from situations where locally derived information is provided with no associated master list or file. An exhaustive ‘master list’ of individuals receiving a public service are, in fact, quite rare. In our study, this occurred with student records such as from the Virginia Department of Education (VDOE). Here the student demographics occur in multiple records about the same student recorded in the same year. Truth must be derived from the multiple observations. For example, the VDOE data we found 16,310 of the 2,346,058 individuals to have more than one value for gender.

A simple consistency check on the field ‘gender’ (in pseudo-code) would look like:

count students
from student_records joined to itself on student\_id
where gender does not match

A consistently troublesome demographic variable, from a longitudinal consistency viewpoint, is race. Race categorization schemes change fairy frequently (in comparison to other demographic categories). In addition, people will periodically elect to change the racial category with which the identify.

A lonitudinal consistency check of race in the Virginia Student Record Collection:

SELECT distinct a.unique_id
FROM student_mobility_fields_2005_2015 a
JOIN student_mobility_fields_2005_2015 b
ON a.unique_id = b.unique_id
WHERE a.race_type <> b.race_type

## [1] 160055

In the Virginia Student Record Collection there are 160055 such inconsistencies. This means the dataset is about .37% inconsistent (which actually means it is still a pretty good variable for many uses).
Uniqueness

The concept of data uniqueness can be generalized as the number of unique valid values that have been entered in a record field, or as a combination of record field values within a dataset. Uniqueness is not generally discussed in terms of data quality, but for the purposes of answering research questions, the variety and richness of the data is of paramount importance. Most notably, if a record field has very little value uniqueness (e.g. entries in the field ‘State’ for an analysis of housing within a county, which of course would be within a single state), then its utility would be quite low and can be conceptualized as having low quality in terms of the research question at hand.

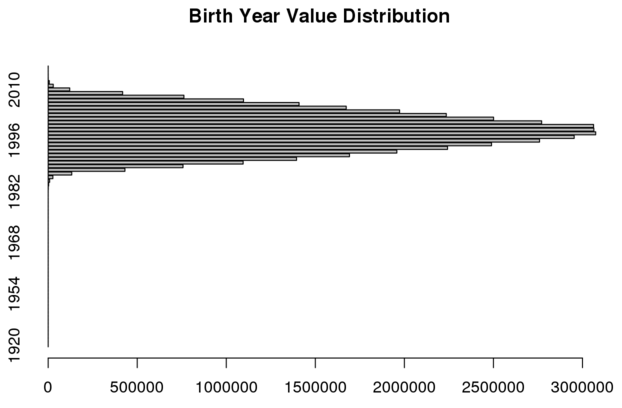
A basic birth year distribution plot is shown using R and SQL:

values_birth_year = dbGetQuery(con, "SELECT birth_year
                                     FROM student_mobility_fields_2005_2015")

# frequency distribution plot of birth_year values
birth_year_frequencies = table(values_birth_year$birth_year)
barplot(birth_year_frequencies, main="Birth Year Value Distribution", horiz=TRUE)

Duplication

Duplication refers to the degree of replication of distinct observations per observation unit type. For example, in state-level secondary-education registration records, greater than 1 registration per student per official reporting period would represent duplication.

However, it is important to remember that while duplication can occur as a result of the accidental entering of the same information multiple times, duplication can occur many times as a direct result of the choice of level of aggregation; for example, aggregating to a single student registration per academic year when registration information is actually collected multiple times per academic year.