Overview
The Social Data Commons supports equity-informed decision-making at the local and regional level. It began as the Social Impact Data Commons, a project of the Social and Decision Analytics Division of the Biocomplexity Institute at the University of Virginia, and grew out of two sponsored projects that share one community process, one pipeline codebase, and one dashboard design.
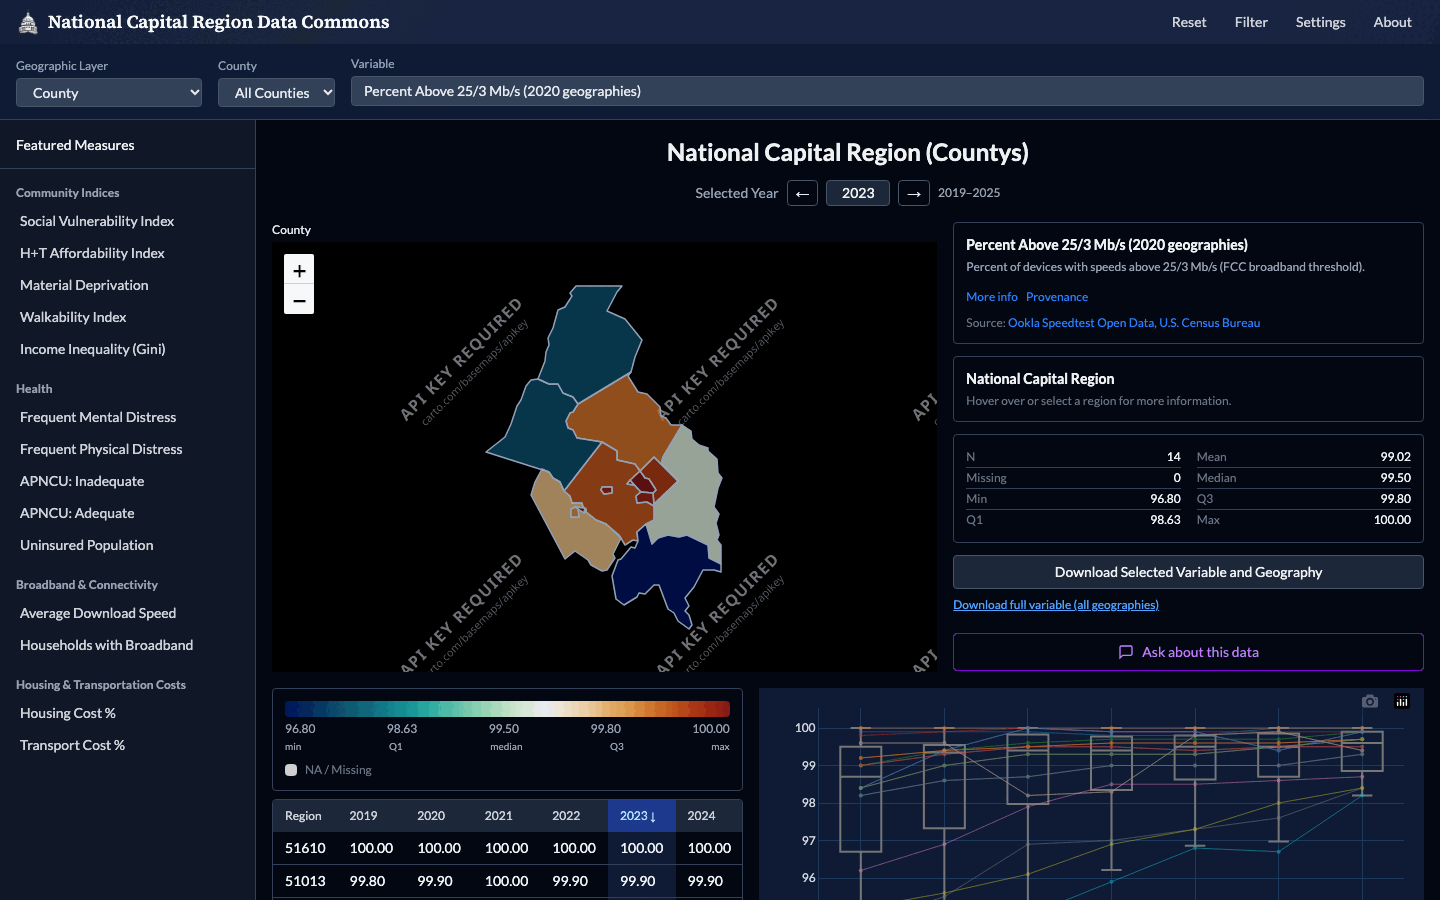
Social Impact Data Commons to Inform Equitable Growth
Grounded in the questions of stakeholders in Arlington and Fairfax Counties: broadband equity, access to care, business diversity, and food security.
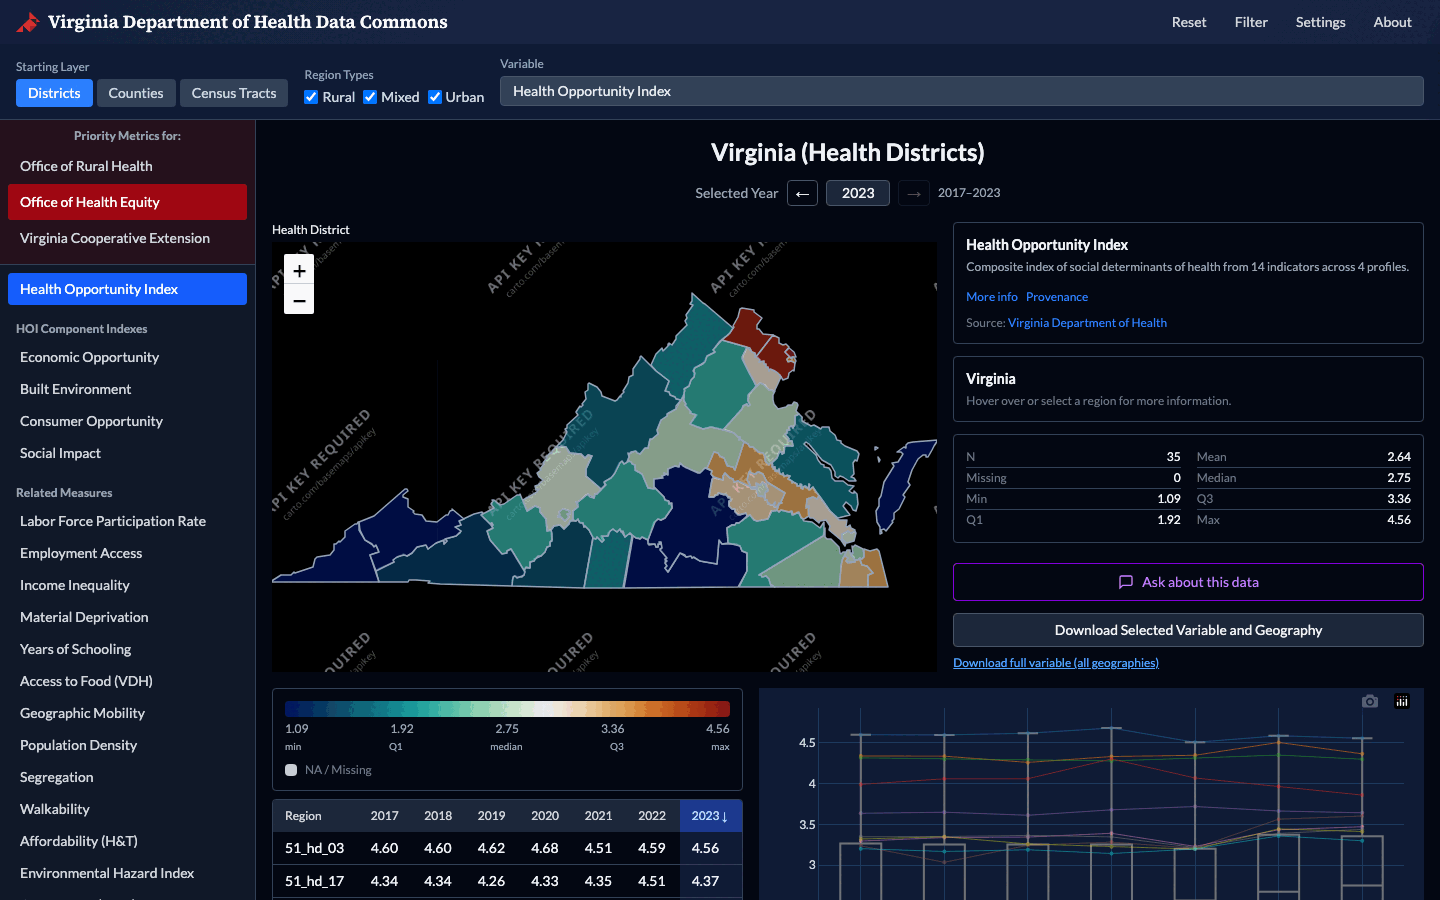
Data Commons to Support Department of Health Strategic Plans
Priority measures for the Office of Rural Health, the Office of Health Equity, and Virginia Cooperative Extension, led by the Health Opportunity Index.
Objective
Most public data stop at the county. Local questions about broadband affordability, access to care, or food insecurity play out at the neighborhood level, so most of the work of the commons is producing sub-county measures and placing them in the geographies local stakeholders actually use. To make impactful, equity-informed decisions, decision-makers need data and indicators that:
- Triangulate on their policy challenges and questions.
- Sit at a geographic level that informs their decision-making.
- Come in a geographic shape that is useful: a planning corridor, a school attendance zone, a civic association, a health district.
- Are validated and timely.
What a finished dataset must be
Once datasets are discovered, vetted, created, synthesized, and validated, they must be easy to assess, access, and analyze. Everything is meant to be both machine readable and human readable.
Assessable
Are these the right data for the policy question?
Maps, tables, charts, and full metadata for every measure on the dashboards, so a dataset can be judged before it is downloaded.
Accessible
Can the data be downloaded?
Direct download from the dashboards, and compressed CSV files with metadata committed to the public GitHub repository.
Analyzable
Can the data go straight into a user's own analysis?
One long-format schema, standardized file names, and 2020 census geographies across every dataset.
What the commons provides
Two open-source dashboards
Lightweight static web applications that run on free hosting such as GitHub Pages. One for Virginia, one for the National Capital Region.
DashboardsOpen data and pipelines
Broadband, business climate, demographics, education, environment, financial well-being, food, health, housing, public safety, and transportation. The code that ingests each source lives beside its output.
Data inventoryOpen-source tools
Published on PyPI: spatial access and availability metrics, redistribution of population data into alternate geographies, and 2010-to-2020 census boundary standardization.
Python packagesData stories
Worked examples that apply the commons to real local issues, each triangulating several measures to answer one question.
Data storiesLooking ahead
The commons is designed to be modular, sustainable, and expandable. Ongoing work extends it into new policy areas and new geographies, creates new policy-relevant indicators, and keeps existing datasets current as new source data are released.
Contact
Aaron Schroeder, Principal Investigator, ads7fg@virginia.edu