Health equity in the National Capital Region
Is access to urgent care health services equitable in Arlington and Fairfax County?
Issue overview
Our partners in Arlington and Fairfax Counties were interested in understanding the equity of access to health services by neighborhood, by race and ethnicity, and by household income. We began by analyzing access to urgent care health services facilities.
We inventoried a variety of urgent care location data sources for accuracy and quality. Given that urgent care is a rapidly growing health care service, we found that administrative datasets were incomplete. We found that Google Maps provided the most complete picture of urgent care locations in the National Capital Region. To get a better understanding of the idea of access, we compared several measures.
Where are urgent care health services in Arlington and Fairfax?
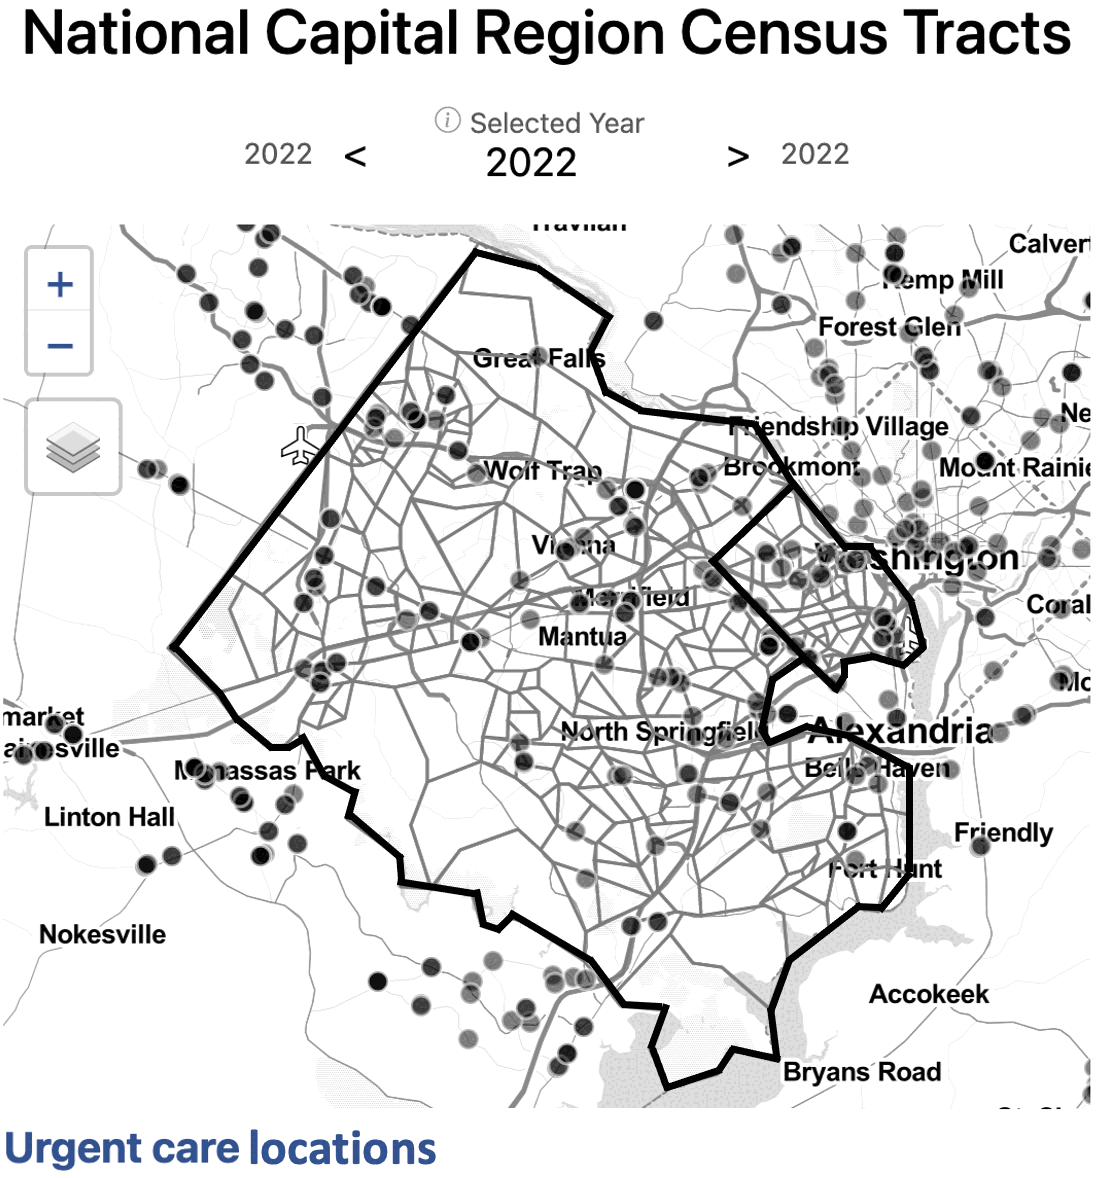
Exhibit 1. Urgent care health services locations in Arlington and Fairfax Counties by census tract, 2022.
Data source: Google Maps, accessed 2022.
First, we examined the locations of urgent care facilities, shown in Exhibit 1.
There are 113 urgent care health services facilities in Fairfax and 18 in Arlington.
By number of facilities, Fairfax has the greatest access to urgent care in the National Capital Region. This would be expected given the Fairfax County population is almost five times larger than Arlington County according to the 2020 Census. Fairfax County is also over 15 times larger by geographic area than Arlington County. We also calculated presence of urgent care by census tract. For most census tracts, there is no urgent care facility present. Fairfax and Arlington residents who live in a census tract without an urgent care facility may be able to easily drive to one nearby.
How long does it take to drive to urgent care?
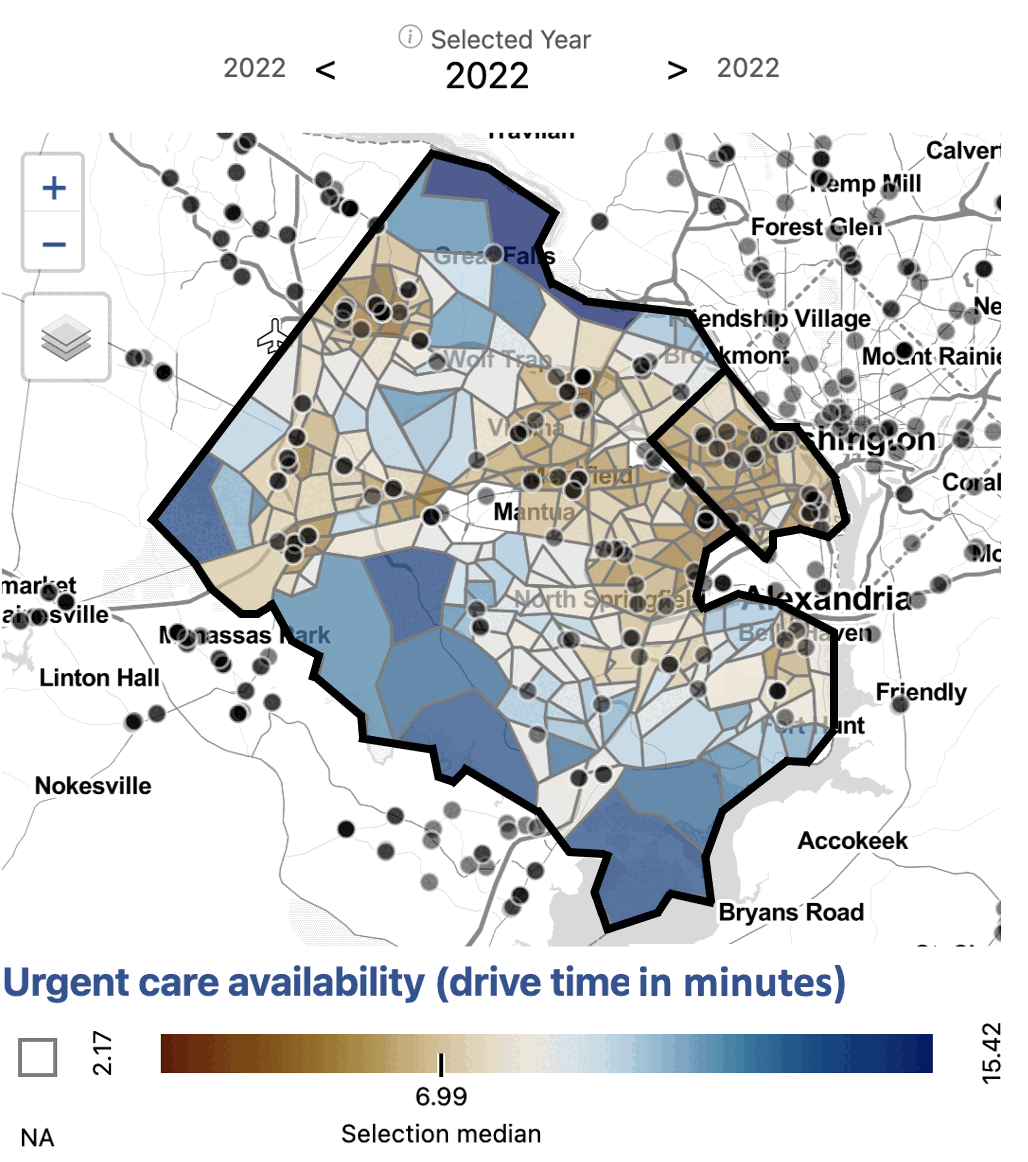
Exhibit 2. Urgent care health services availability by drive time (minutes) in Arlington and Fairfax Counties by census tract, 2022.
Data source: Google Maps, accessed 2022. Drive times calculated using Open Source Routing Machine.
The next measure of access we analyzed was drive time to the ten closest urgent care facilities, shown in Exhibit 2. Here, we begin to see patterns of access emerge.
Fairfax and Arlington residents who live in more urban areas, along major roads, or in Metro corridors have greater access to urgent care by drive time.
In Fairfax, the range of drive time to the ten closest urgent care facilities is three to over 15 minutes. Across Arlington, the range is two to nine minutes. In both counties, geographic inequities exist in access to urgent care. Our measure of access, though, still does not take into account any population-level information.
How do we develop a comprehensive measure of access?
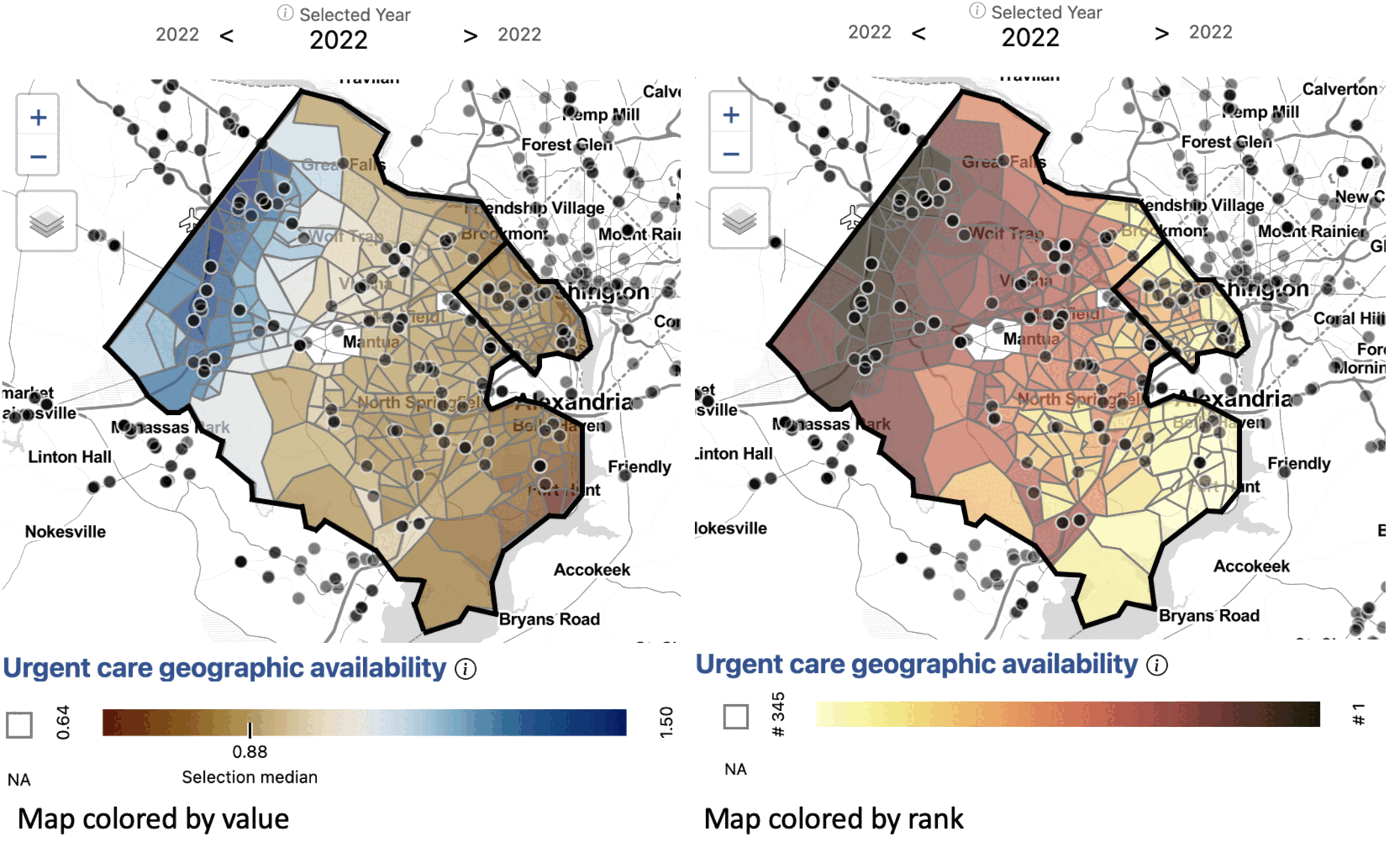
Exhibit 3. Value (left) and rank (right) of 3-step floating catchment areas for urgent care health services access in Arlington and Fairfax Counties by census tract, 2022.
Data source: Google Maps, accessed 2022. Population data from the American Community Survey. Drive times calculated using Open Source Routing Machine.
Next, we analyzed access to urgent care by geographic availability using
three-step floating catchment areas. A three-step floating catchment area
aggregates the ratio of urgent care facilities to population, weighted by
travel time. This provides a more complete picture of access in these
counties. (The method is implemented in the
sdc-catchment package.)
In Fairfax, the areas with the lowest access to urgent care are northern McLean and the southwestern neighborhoods, including Fort Hunt and Huntington.
In Arlington, neighborhoods near Marymount University and southern neighborhoods below Columbia Pike have the lowest access.
These areas have relatively high populations given the proximity of urgent care. The area with the greatest access is Centreville, Chantilly, and Herndon, which lie along major roads in western Fairfax and have a relatively high number of urgent care facilities for the population. Bailey's Crossroads and Annandale also have comparatively low access for the region.
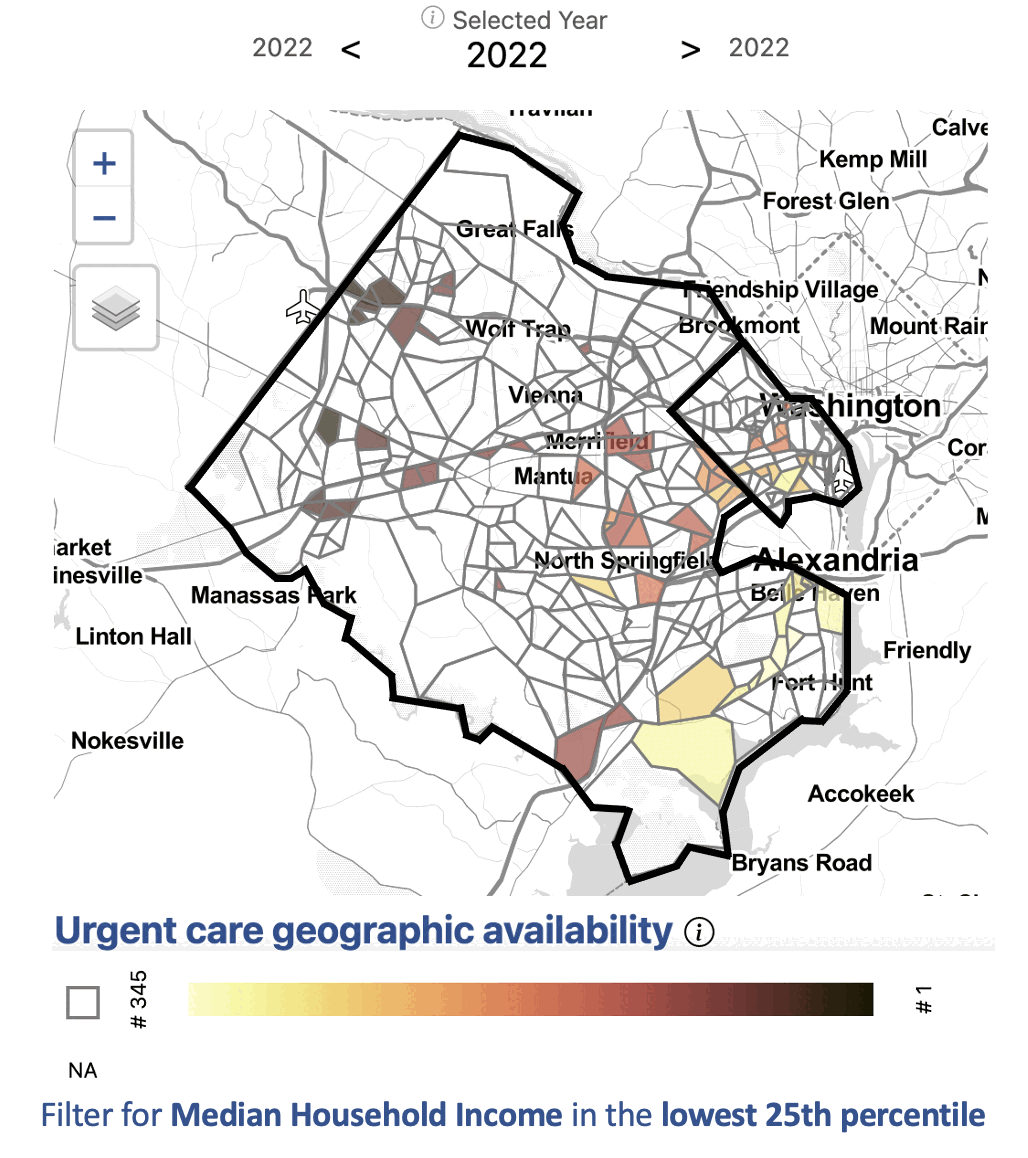
Exhibit 4. Rank of 3-step floating catchment areas for urgent care access, filtered to census tracts in the lowest quartile of median household income, Arlington and Fairfax Counties, 2022.
Data source: Google Maps, accessed 2022. Population data from the American Community Survey. Drive times calculated using Open Source Routing Machine.
Applying filters to the dataset can help us zero in on populations and neighborhoods of interest. In this case, we filter for census tracts with a median household income in the lowest 25th percentile (below $101,838). This filter shows that some census tracts with low median household income are well served by urgent care, particularly in western Fairfax near Centreville, Chantilly, and Herndon.
Many census tracts, such as those in southern Arlington, Annandale, Bailey's Crossroads, and near Fort Hunt, have both a relatively low median household income and relatively low access to urgent care.
Is there inequity in access by demographics?
Exhibit 5. Asian American/Pacific Islander (top left), Black (top right), Hispanic/Latino (bottom left), and White (bottom right) population in Arlington and Fairfax Counties by census tract, 2019.
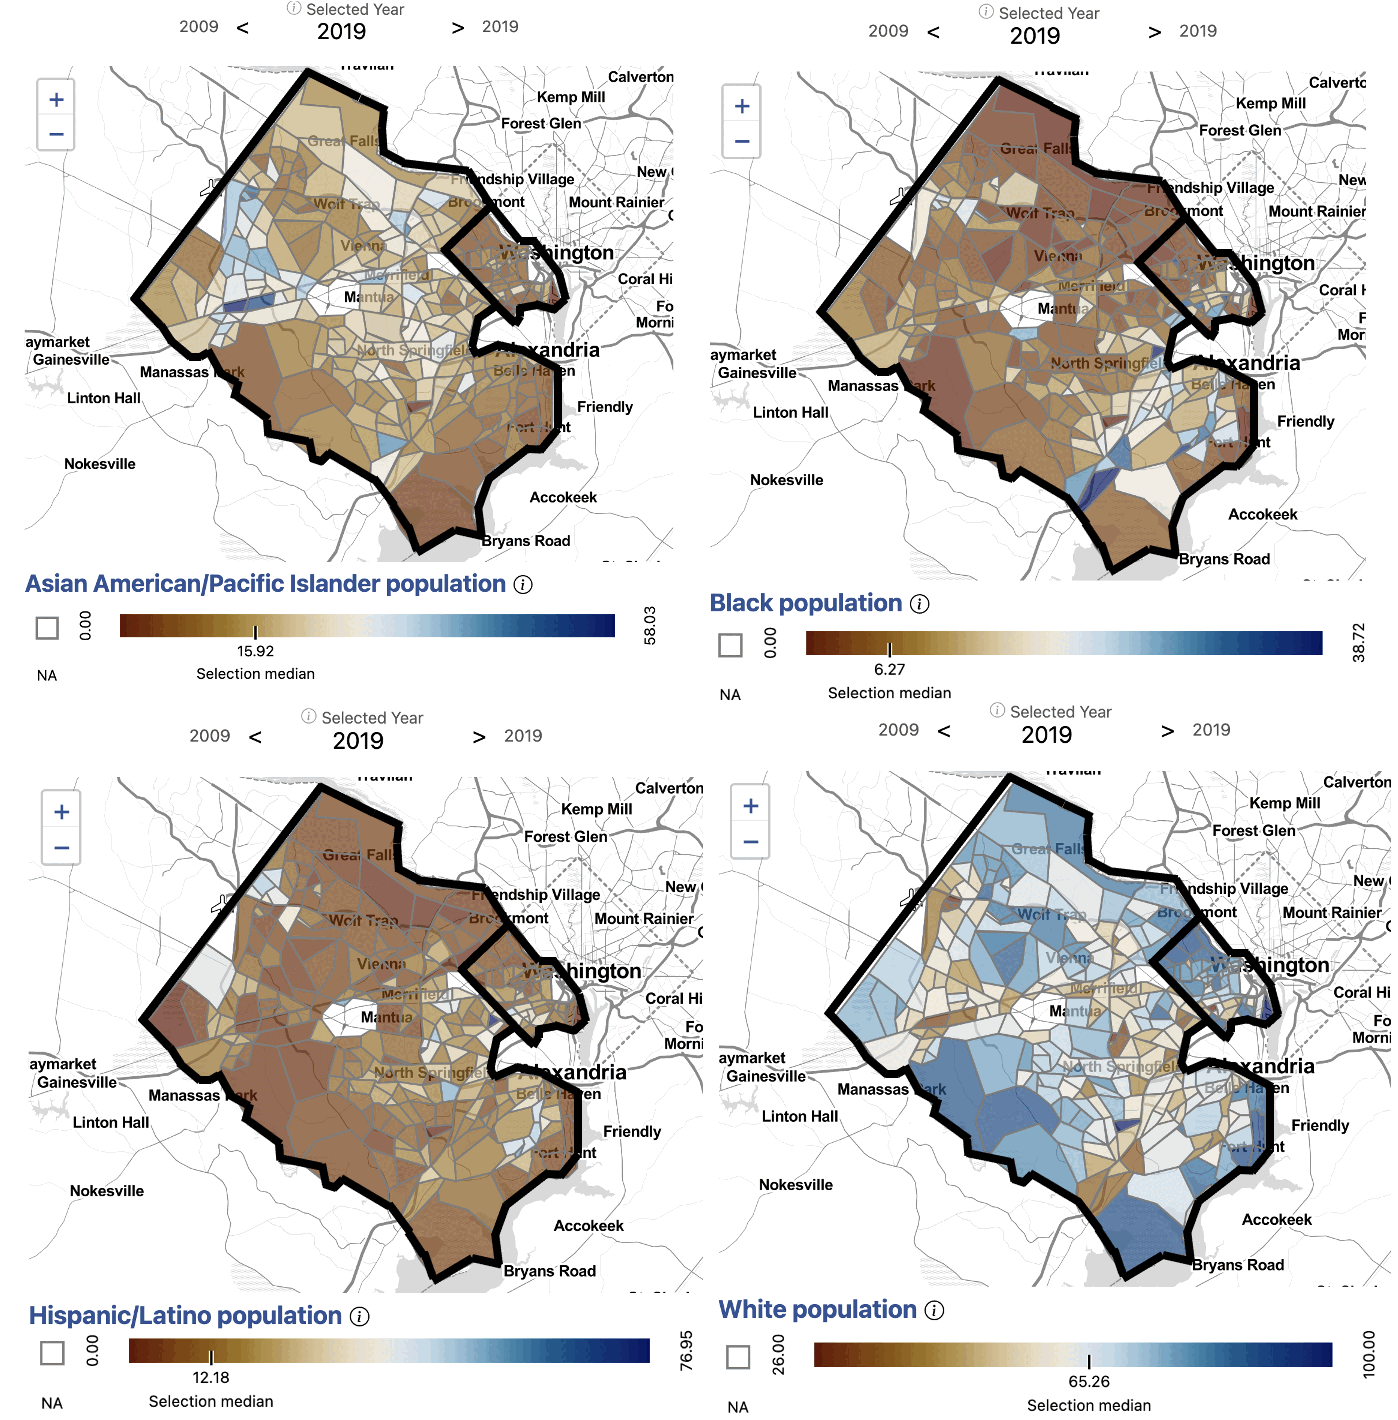
Data source: American Community Survey, Table B01001, accessed 2021.
After developing a comprehensive measure of access, we began to dig into the question of equity of access to urgent care by demographics. We observed that the neighborhoods affected by low access have different demographic compositions.
Northern Arlington, where the population is largely White and high income on average, has some of the lowest access to urgent care in the region.
Southern Arlington and the neighboring Bailey's Crossroads and Annandale in Fairfax have higher Hispanic/Latino populations and lower income on average. These areas also have relatively low access to urgent care.
Centreville, McLean, and Tysons Corner have larger Asian American/Pacific Islander populations. Centreville has some of the highest access to urgent care in the region, while McLean has some of the lowest.
Some census tracts in Huntington and Fort Hunt have higher than average Black populations and lower than average household income. These areas are also the most underserved in access to urgent care.
In addition to income and demographic variables, we could explore access by additional factors affecting health equity, including primary language spoken at home or access to health insurance.
Having a comprehensive knowledge of the equity of access to urgent care within neighborhoods in Fairfax and Arlington empowers our local stakeholders to make more effective policy decisions to address and correct inequities.
Exploring access to additional health services
Using the commons, we can explore access to additional health services using an equity lens. For example, we can explore differences in access to hospitals, primary care physicians, or substance use facilities. We find that access to these services across Fairfax and Arlington does not necessarily follow the same pattern. Using specific measures, policymakers can make informed decisions to address specific health equity gaps.
Analyzing the data yourself
Every measure on the dashboards is also a compressed CSV in the Social-Data-Commons repository, so an analysis like this one is a few lines of pandas. The example below reads the urgent care access scores and the race and ethnicity shares for every tract in the region, keeps Arlington and Fairfax, and correlates each group's population share with the three-step floating catchment score.
import pandas as pd

BASE = (
    "https://raw.githubusercontent.com/dads2busy/Social-Data-Commons/main/"
    "dashboard_data/national_capital_region_data/"
)
urgent = pd.read_csv(BASE + "ncr_tr_nppes_2020_2025_access_scores_urgent.csv.xz", dtype={"ID": str})
race = pd.read_csv(BASE + "ncr_tr_census_acs_2010_2024_race_demographics.csv.xz", dtype={"ID": str})

# Arlington (51013) and Fairfax (51059) census tracts in one year
year = 2023
df = urgent[urgent["time"] == year].merge(race[race["time"] == year], on=["ID", "time"])
df = df[df["ID"].str[:5].isin(["51013", "51059"])].copy()
df["county"] = df["ID"].str[:5].map({"51013": "Arlington", "51059": "Fairfax"})

groups = {
    "race_AAPI_percent_geo20": "Asian American / Pacific Islander",
    "race_afr_amer_alone_percent_geo20": "Black",
    "race_hispanic_or_latino_percent_geo20": "Hispanic or Latino",
    "race_wht_alone_percent_geo20": "White",
}

# Correlation between each group's population share and urgent care access (3SFCA)
corr = df.groupby("county").apply(
    lambda g: g[list(groups)].corrwith(g["urgent_3sfca"]), include_groups=False
)
print(corr.rename(columns=groups).round(2).T)
In the original analysis, urgent care access varied across census tracts in Arlington without a clear relationship to demographics. In Fairfax, tracts with higher Asian American/Pacific Islander populations tended to have higher access, and tracts with higher Black and White populations tended to have lower access. Running the example above against the current data lets you check whether those patterns have held.
Explore the measures
Urgent care access scores (facility count, drive time, and floating catchment area) are available on the National Capital Region dashboard under Health.