Food insecurity
How do we measure food insecurity in Fairfax County?
Issue overview
The current measure of food insecurity, the USDA Current Population Survey Food Security Supplement, monitors food insecurity over time at national and state levels. Our stakeholders, local governments and nonprofits, want food insecurity measures at a smaller geographic level. Such knowledge would permit local officials to better address the problem in identifiable small geographies with targeted outreach and mitigation strategies, such as nutrition education and social service referrals.
We accomplish this by modeling food insecurity as a function of household income, size, composition, and the census tract where the household resides, and categorize a household as food insecure, at risk of food insecurity, or food secure using the cost of living as the threshold.
Calculating local cost of living
We define the cost of living as the amount of income necessary to pay federal and state income taxes and to meet a household's needs to function at a modest yet adequate standard of living. We include "living" in our designation to connect this to the "living wage" and to distinguish that the cost of living is not set at a deprivation level. Instead, it is a budget that could be used to define a living wage. We reviewed the following calculators to build a sense of the existing solutions:
- The Living Wage Calculator from the Massachusetts Institute of Technology
- The Family Budget Calculator from the Economic Policy Institute
- The Self-Sufficiency Standard from the University of Washington's Center for Women's Welfare
We found that the available cost of living calculators did not meet our need for detail at the sub-county level. To construct a sub-county cost of living, we completed a data discovery to find available sources for budget categories at a geographically granular level and replicable across the National Capital Region. The basic needs include housing, food, transportation, healthcare, childcare, broadband, and other necessities such as clothing, household supplies, personal care, nonprescription medicine, and school supplies.
The household income standard estimates are a function of family size and composition and where the family resides. They assume the total cost of each need without government subsidies (such as public housing, Medicaid, or childcare assistance) and without nonprofit or informal assistance from family and friends (such as unpaid childcare by a relative, food from food banks, or shared housing). A cost of living budget was calculated for every household combination within a census tract.
Approach to measuring food insecurity
To estimate food insecurity at the census tract level using the cost of living as the threshold, we used household data at the Public Use Microdata Area (PUMA) level and aggregated household income and size data at the census tract level from the American Community Survey (ACS). Iterative proportional fitting (IPF) was used to estimate the number of households in each income-by-size category within a census tract, subject to constraints from known and fixed marginal row and column totals.1 2 The marginal row and column totals are household income (ACS Table S1901) and household size (ACS Table B11016) at the census tract level. For each census tract the procedure was:
- fill the body of the table with starting values (seeds), which were adjusted iteratively to match the row and column marginal totals;
- adjust the cells in each row by multiplying each cell by the ratio of the fixed row marginal to the actual row sum;
- adjust the cells in each column by multiplying each cell by the ratio of the fixed column marginal to the actual column sum.
Iterations between steps 2 and 3 were performed until the stop criterion was
reached: either the difference between iterations was less than 10-11 or
the number of iterations reached 1,000. For example, the fitted table for
census tract 450100 contains 135 two-person households with an income in the
range $75,000 to $99,999. For Fairfax County, 274 two-way tables were
estimated, each with 45 cells. All computations were done using the R package
for multidimensional array fitting, mipfp.3
A monthly cost of living midpoint was calculated for each household size by income category (each cell in the census tract table). The midpoint was then compared to the limits of the income category to classify all the households within a cell as secure, insecure, or at risk. For each cell:
- calculate the cell threshold by summing the seven components of the cost of living excluding food (transportation, healthcare, childcare, housing, broadband, other expenses, and taxes) for each household combination of a particular household size, and take the midpoint;
- estimate the food budget range for a cell as the difference between the cell threshold and the lower end of the income category, and between the cell threshold and the upper end;
- calculate the monthly food cost for the household size using the USDA monthly low-cost food plan;
- compare the USDA monthly food cost to the food budget range. If the food cost is less than the lower end of the range, the household is food secure; if it is greater than the upper end, the household is food insecure; if it falls within the range, the household is at risk.
Findings
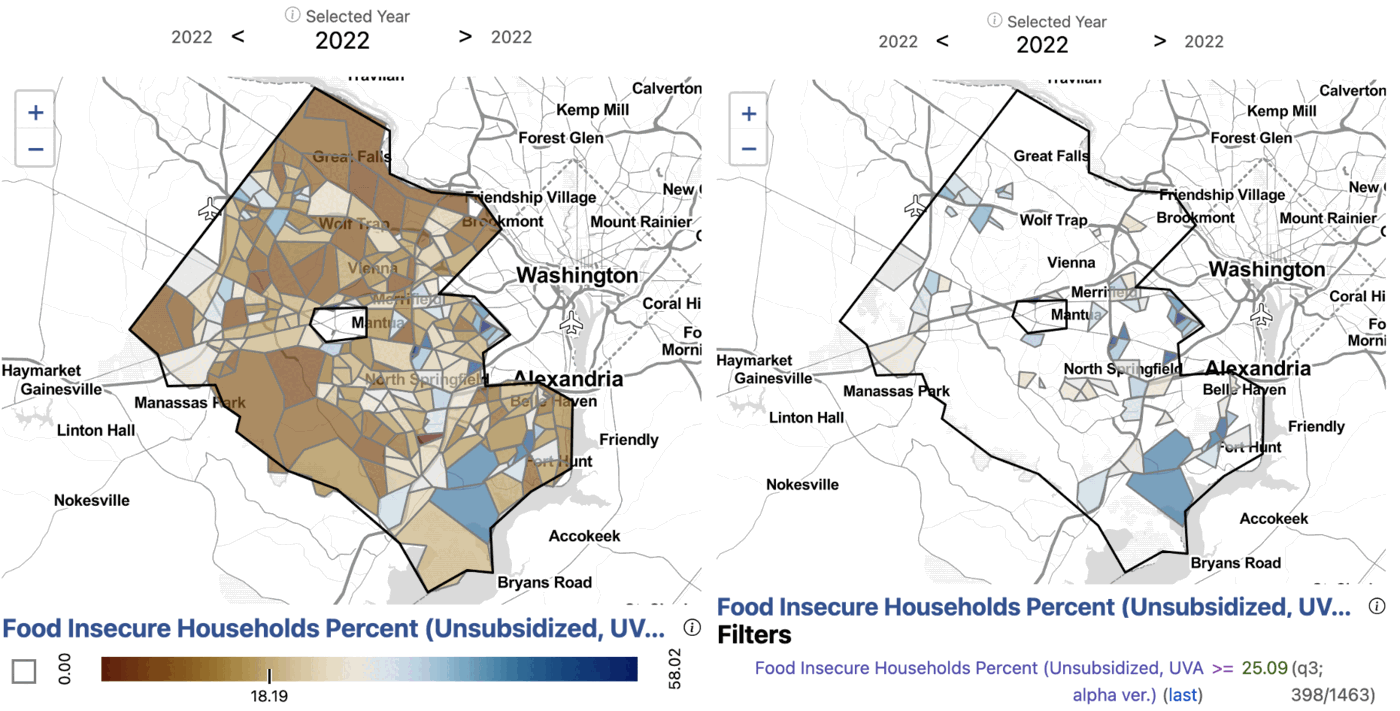
Exhibit 1. Estimated percentage of households that are food insecure in Fairfax County by census tract.
Data sources: USDA; Feeding America; U.S. Department of Housing and Urban Development; Center for Neighborhood Technology; Health Insurance Marketplace; Department of Labor Women's Bureau; BroadbandNow; National Academy of Sciences; National Bureau of Economic Research TAXSIM version 35. All accessed 2022.
Applying our methodology, we can explore food insecurity at the census tract level in Fairfax County. We find that the estimated percentage of households facing food insecurity in Fairfax is 20 percent. This estimate is within the margin of error of the food insecurity estimate from the survey conducted by the National Opinion Research Center at the University of Chicago in 2022 for the Capital Area Food Bank. Within the county, census tracts range from 0 percent to 58 percent food insecure.
Census tracts with the highest percentage of the population estimated to be food insecure include southern Fairfax near Alexandria along Route 1, North Springfield, Merrifield, along Leesburg Pike near southern Arlington, western Fairfax near Dulles, and western Herndon.
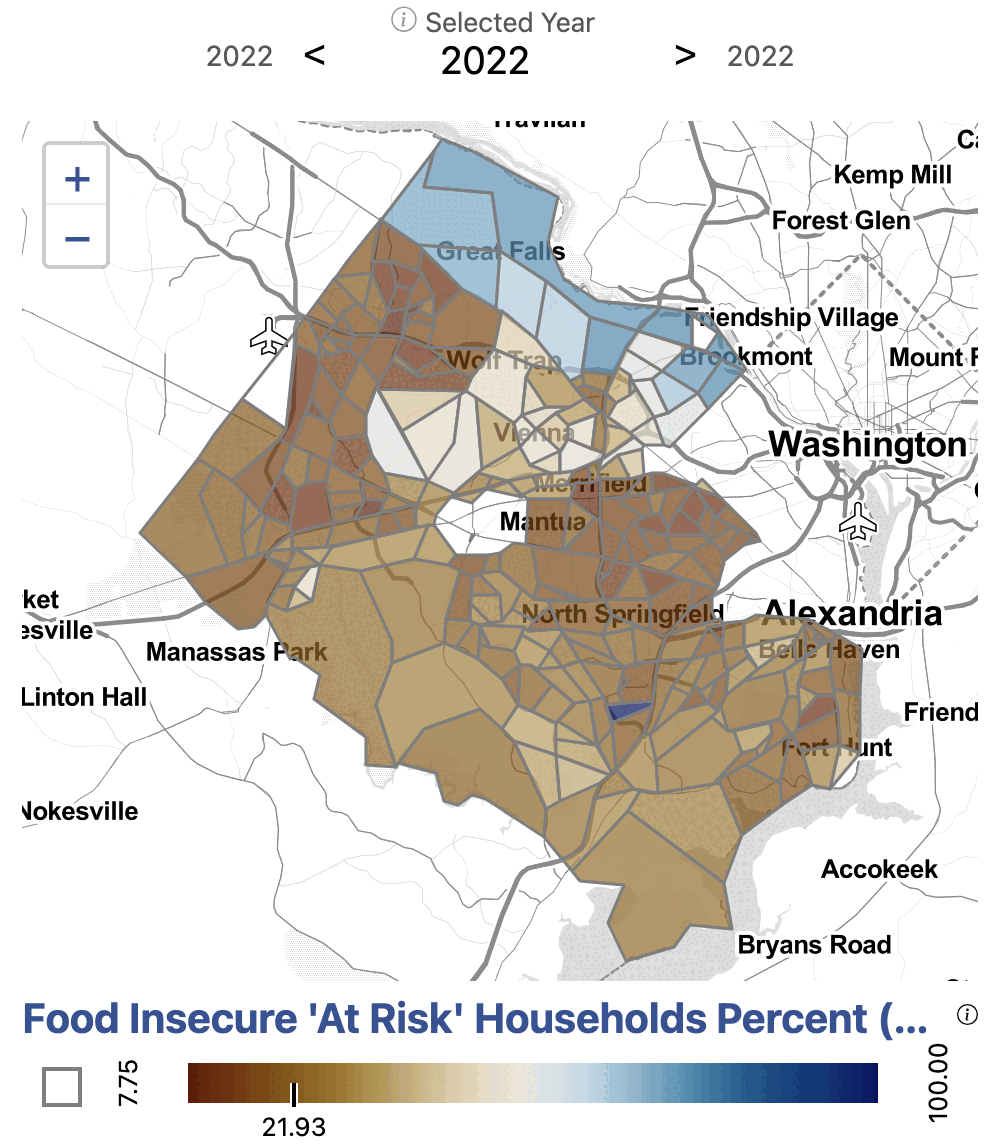
Exhibit 2. Estimated percentage of households at risk of food insecurity in Fairfax County by census tract.
Data sources: as for Exhibit 1.
Our methodology distinguishes households that are in an ambiguous position of being food secure: they are at risk of food insecurity. Across Fairfax overall, 26 percent of households are at risk of facing food insecurity.
The demographics of food insecure neighborhoods
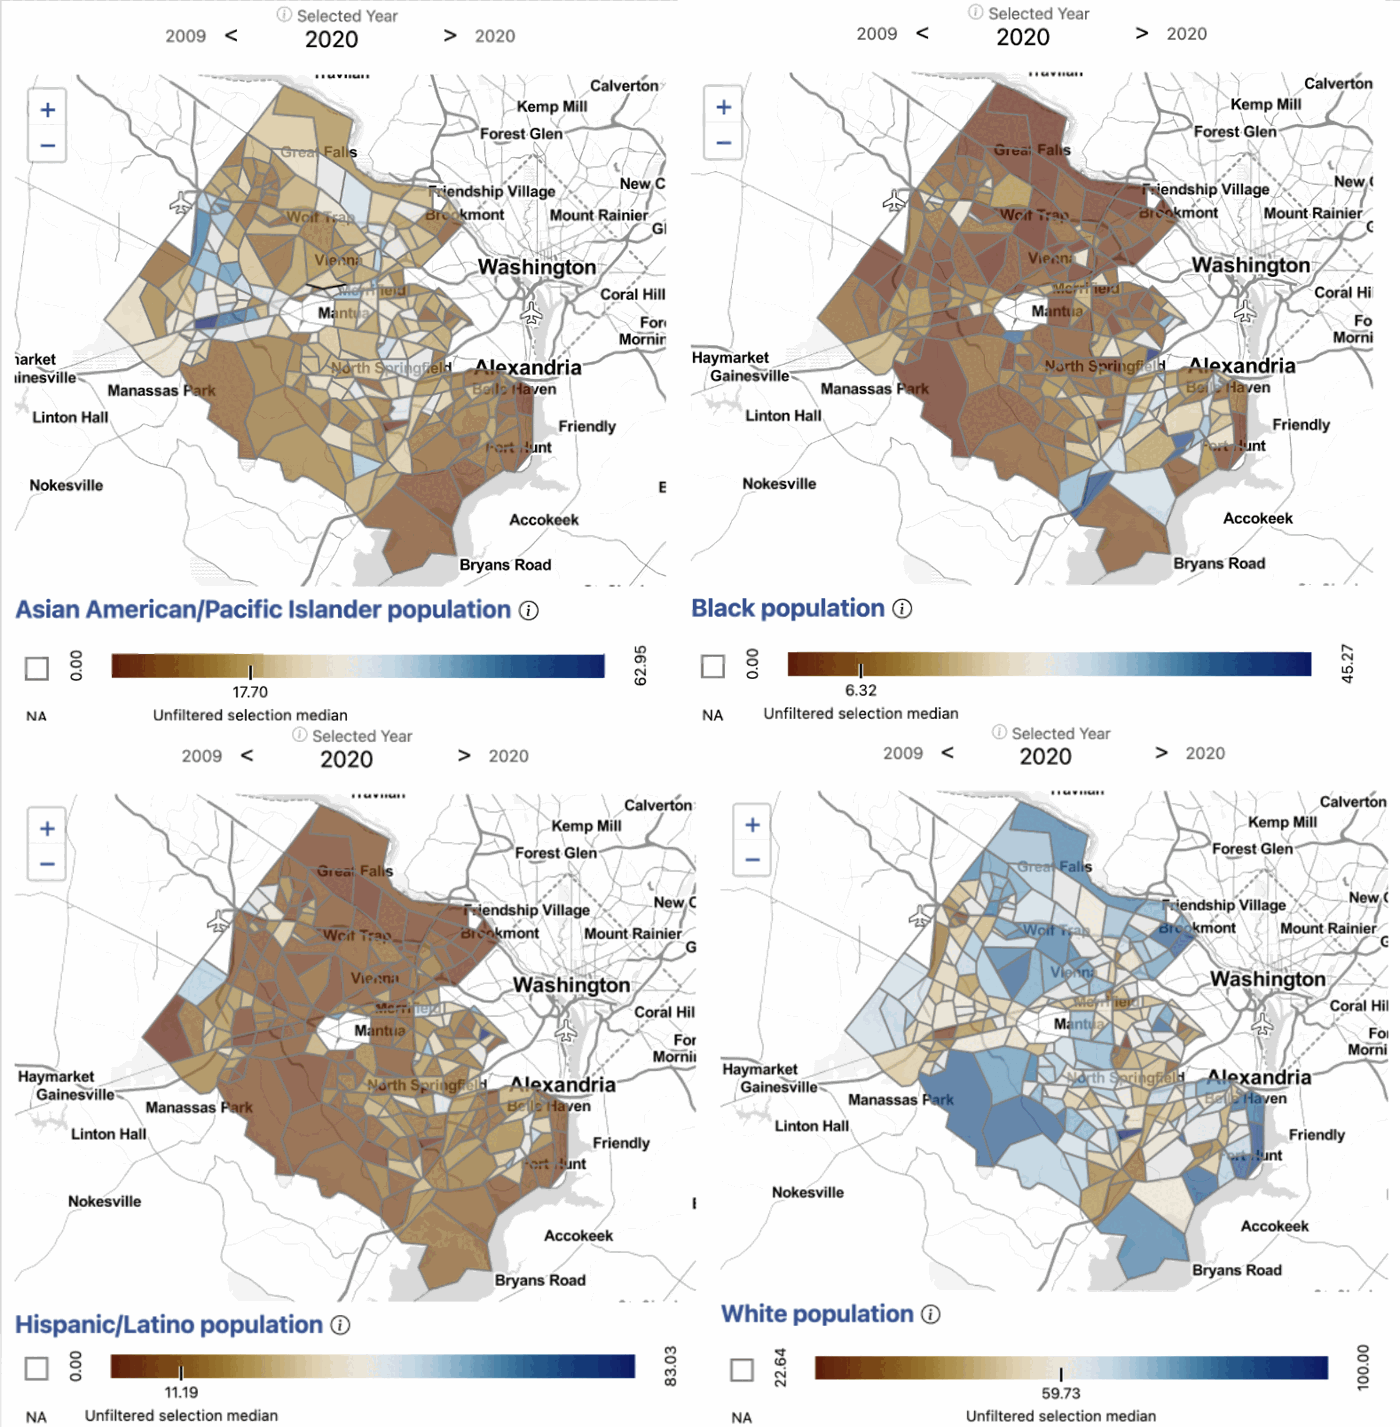
Exhibit 3. Asian American/Pacific Islander (top left), Black (top right), Hispanic/Latino (bottom left), and White (bottom right) population in Fairfax County by census tract, 2019.
Data source: American Community Survey, Table B01001, accessed 2021.
When we overlay patterns of food insecurity with demographics, we can see patterns in the burden of food insecurity. Southern Fairfax near Alexandria along Route 1, which is disproportionately food insecure, has a higher Black population as well as a higher Hispanic/Latino population. Similarly, North Springfield and Leesburg Pike near southern Arlington also have higher Black and Hispanic/Latino populations. Merrifield, western Fairfax near Dulles, and western Herndon, which experience higher than average food insecurity, have a higher than average Asian American/Pacific Islander population.
Looking at the at-risk population, which is concentrated in Great Falls and McLean, we see that these areas are made up of predominately White as well as Asian American/Pacific Islander populations.
Food insecurity with access to subsidies
Read more about the Supplemental Nutrition Assistance Program (SNAP) in Fairfax County on the SNAP analysis page.
When we add SNAP access to our model, the percentage of households facing food insecurity falls to 19 percent. The minimum percentage of food insecure population in a census tract is 0 percent and the maximum is 55 percent. The percentage of at-risk households has a mean of 16.7 percent across census tracts, with a minimum of 16.7 percent and a maximum of 100 percent.
Explore the measures
Food access and food assistance measures for the region are available on the National Capital Region dashboard, and for Virginia on the Virginia dashboard under Access to Food.
-
Beckman, R. J., Baggerly, K. A., & McKay, M. D. (1996). Creating synthetic baseline populations. Transportation Research Part A: Policy and Practice, 30(6), 415–429. ↩
-
Deming, W. E., & Stephan, F. F. (1940). On a least squares adjustment of a sampled frequency table when the expected marginal totals are known. The Annals of Mathematical Statistics, 11(4), 427–444. ↩
-
Barthélemy, J., & Suesse, T. (2018). mipfp: An R Package for Multidimensional Array Fitting and Simulating Multivariate Bernoulli Distributions. Journal of Statistical Software, Code Snippets, 86(2), 1–20. doi:10.18637/jss.v086.c02 ↩