Guides
Longer-form, step-by-step guides produced by the Social Data Commons. Each one takes a method the commons relies on and walks through it with real data, working code, and the judgement calls along the way, so that an analyst in another jurisdiction can repeat it.
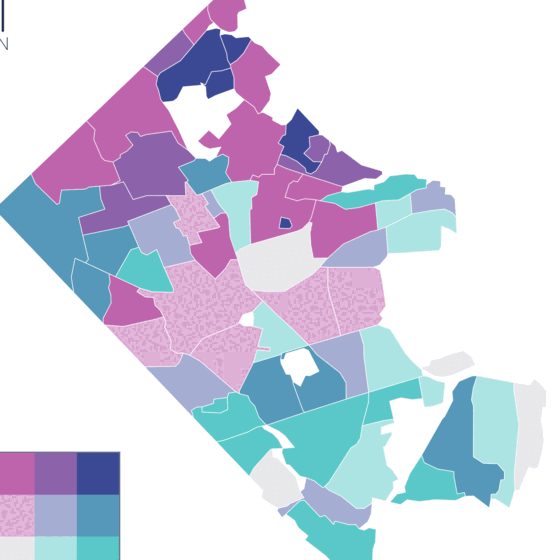
Creating Local-Level Geographic Datasets
- Areal interpolation
- Parcel-based redistribution
- Census block groups to civic associations
- Python and R pipelines
Local officials decide at the neighborhood level, but the data they get stops at the county. The guide shows how to move official statistics onto the boundaries people actually plan with, using Arlington County's broadband speed and household income redistributed to its 62 civic associations, then how to judge the uncertainty and apply the same pipeline anywhere.
- The sub-county data gap
- The problem of misaligned boundaries
- The data
- The core method: areal interpolation
- Worked example: Arlington, step by step
- Results and interpretation
- A second approach: parcel-based redistribution
- Limitations and uncertainty
- Apply it to your own jurisdiction
- The complete pipeline code (Python)
- The complete pipeline code (R)
- References
Cite as: Schroeder, A. (2026). Creating Local-Level Geographic Datasets: A Practical, Illustrated Guide for Sub-County Policy Analysis. Mastercard Center for Inclusive Growth. dads2busy.github.io/local-level-data-guide
Read the guide · Source and pipeline on GitHubThe methods in this guide are the ones behind the
sdc-redistribute package and the
custom geographies on the
National Capital Region dashboard.