Dashboards
Every measure in the commons is published on one of two interactive dashboards. Both are lightweight static web applications, built with Next.js, React, TypeScript, Leaflet, Plotly.js, and Tailwind CSS, and hosted for free on GitHub Pages. They share one data format and one codebase pattern, so a measure prepared for one is prepared in the same shape for the other.
On either dashboard you can:
- map a measure at any available geographic level and step or animate it through time;
- compare regions with scatter, bar, and box plots;
- filter and sort regions, and read summary statistics for the selection;
- open the full metadata, source, and provenance of a measure;
- download the selected variable and geography, or the full variable across all geographies.
Virginia Department of Health Data Commons
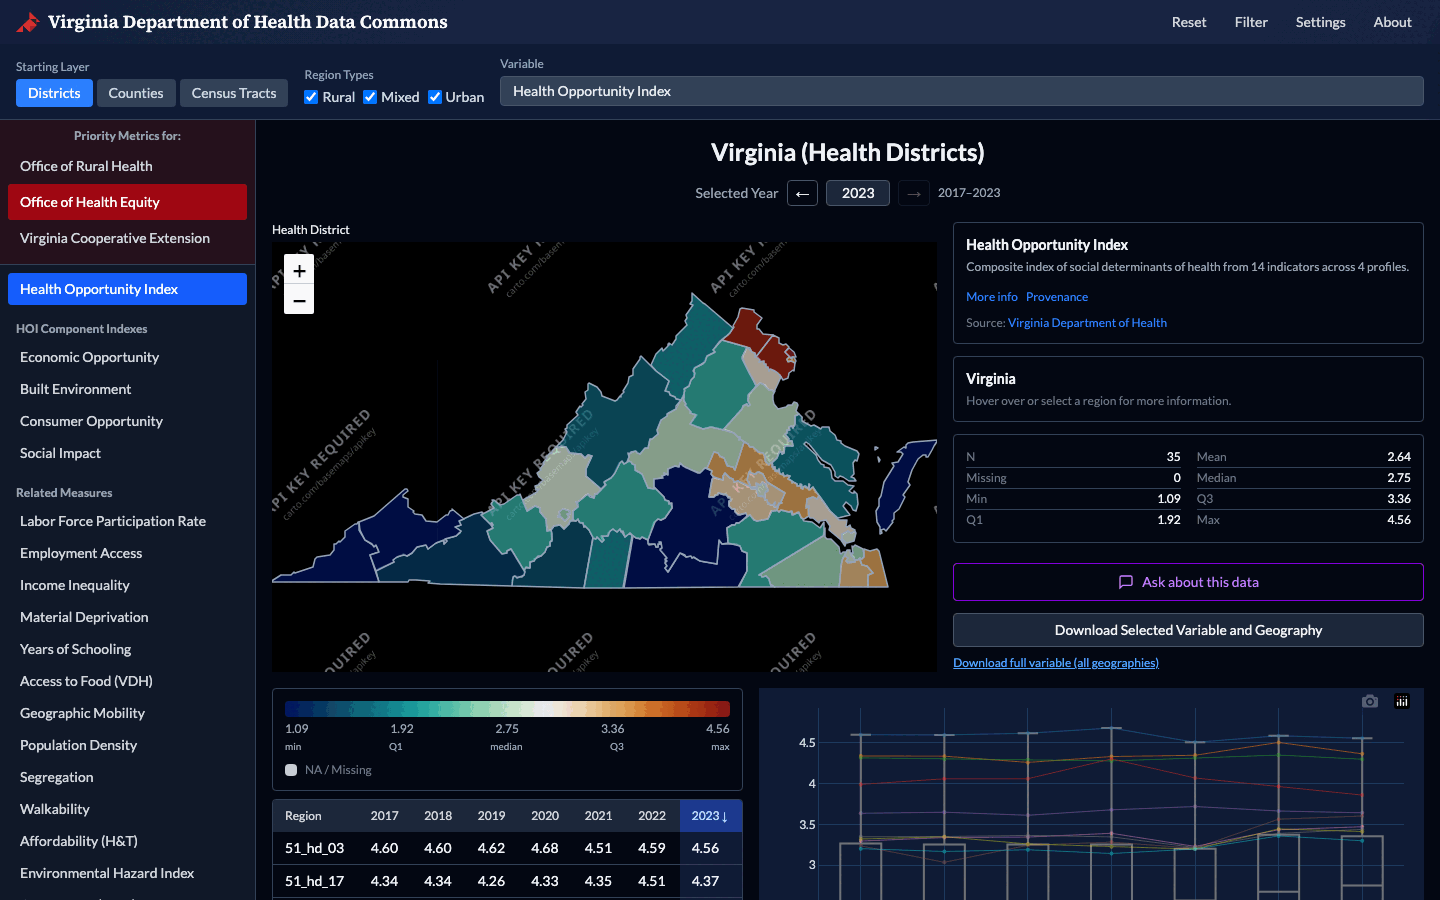
dads2busy.github.io/virginia_public_health_data
Built for the Virginia Department of Health to support its strategic plans, with priority measures for the Office of Rural Health, the Office of Health Equity, and Virginia Cooperative Extension.
| Coverage | All of Virginia |
| Geographies | Health districts, counties, census tracts, with rural, mixed, and urban region types |
| Featured measure | The Health Opportunity Index and its component indexes: economic opportunity, built environment, consumer opportunity, and social impact |
| Related measures | Labor force participation, employment access, income inequality, material deprivation, years of schooling, access to food, geographic mobility, population density, segregation, walkability, housing and transportation affordability, environmental hazard, access to care, incarceration, and more |
National Capital Region Data Commons
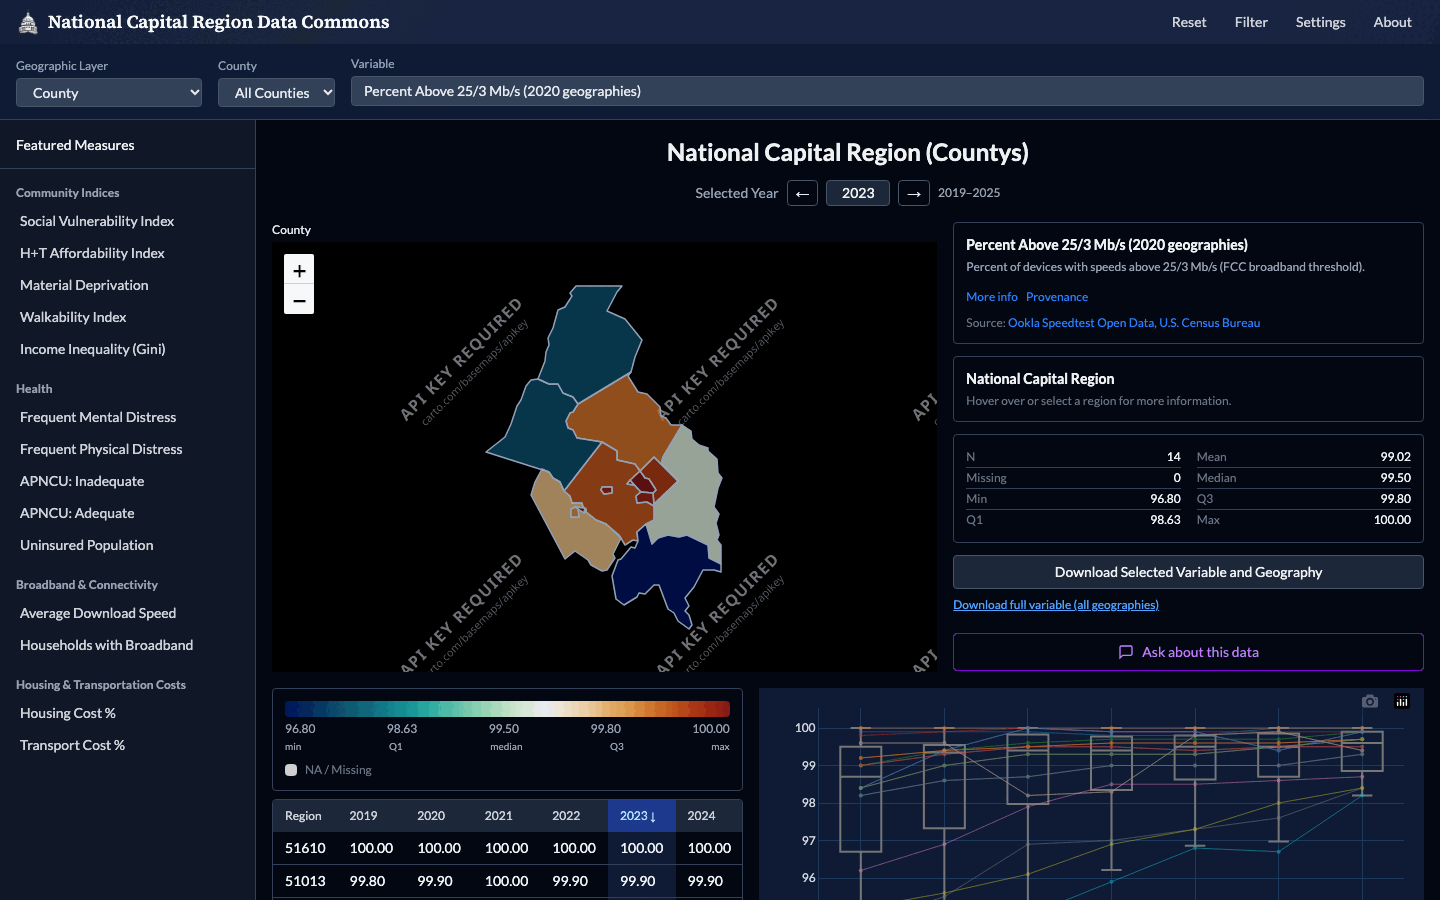
dads2busy.github.io/national_capital_region_data
The successor to the original Social Impact Data Commons dashboard for the National Capital Region, developed with the Mastercard Center for Inclusive Growth and grounded in the questions of stakeholders in Arlington and Fairfax Counties.
| Coverage | The District of Columbia and the surrounding counties in Virginia and Maryland |
| Geographies | Counties, census tracts, block groups, and local shapes such as civic associations, zip codes, planning districts, supervisor districts, and human services regions |
| Measure groups | Community indices (Social Vulnerability Index, H+T Affordability Index, material deprivation, walkability, income inequality), health (mental and physical distress, insurance, prenatal care adequacy), broadband and connectivity, housing and transportation costs, and more |
Data behind the dashboards
The per-level files each dashboard loads are committed to the
dashboard_data/
directory of the repository, next to the long-format distribution files and
measure_info.json metadata that produced them. See
How datasets are built for the
pipeline that generates them.