Our approach
Two things shape every dataset in the commons: a community process that decides what is worth measuring, and a standard pipeline that turns raw sources into data people can use. This page covers both.
Community Learning through Data-Driven Discovery
The commons is built using the Community Learning through Data-Driven Discovery (CLD3) framework developed by the Social and Decision Analytics Division. The key innovation in CLD3 is, as its name suggests, community-based research: the community participates in asking and answering the questions that drive information gathering and provide insights relevant to program or policy decisions. The process liberates, integrates, and makes data available to local stakeholders, including government, Cooperative Extension professionals, researchers, and citizens, enabling them to bring local data insights to their most pressing challenges.
CLD3 goes beyond the organizing aspects of traditional collective action programs and helps communities build capacity for data-informed decision making. It is drawn as a set of nested wheels:
- Outer wheel: continuous interaction and communication across stakeholders.
- Middle wheel: the data-driven learning process: discover, integrate, act, measure and evaluate, redirect.
- Frontier between the wheels: active collaboration between all partners.
- Inner circle: a rigorous research framework to guide the data science.
Our initial grounding in specific local issues was developed in partnership with community stakeholders in Arlington and Fairfax Counties, Virginia. The first issues were equity of access to broadband, equity and stability of access to staple foods, and transforming racial equity data into meaningful geographies. Each became a data story.
Data science framework
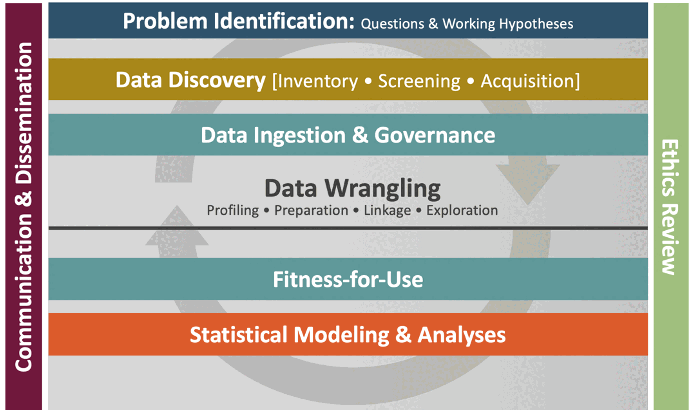
At the heart of CLD3 is a data science framework that gives a comprehensive, rigorous, and disciplined approach to problem solving. It covers identifying data sources, preparing them for use, and assessing the value of those sources for the intended use. The framework is described in a linear fashion, but in practice it loops: a finding in one step routinely sends the work back to an earlier one.
Further reading:
- Keller, S. A., Shipp, S. S., Schroeder, A. D., & Korkmaz, G. (2020). Doing Data Science: A Framework and Case Study. Harvard Data Science Review, 2(1).
- Keller, S., Nusser, S., Shipp, S., & Woteki, C. (2018). Helping Communities Use Data to Make Better Decisions. Issues in Science and Technology, Spring, 83–89.
- Keller, S., Shipp, S., Korkmaz, G., Molfino, E., Goldstein, J., Lancaster, V., Pires, B., Higdon, D., Chen, D., & Schroeder, A. (2018). Harnessing the power of data to support community-based research. WIREs Computational Statistics. doi:10.1002/wics.1426
- Keller, S. A., Lancaster, V., & Shipp, S. (2017). Building Capacity for Data Driven Governance: Creating a New Foundation for Democracy. Statistics and Public Policy, 4, 1–11.
How datasets are built
Once a question has been grounded with stakeholders and the data discovery is done, each measure becomes a pipeline in the Social-Data-Commons repository. Every pipeline follows the same six steps and produces the same shape of output, which is what lets a dashboard, an analyst, or another pipeline use any dataset without special handling.
-
Declare the source
Each topic has a
pipeline.yamlthat records where the data come from, which variables are pulled, which years, and which coverage area. Sources include the Census Bureau's American Community Survey, CDC WONDER and PLACES, the Centers for Medicare & Medicaid Services, the National Plan and Provider Enumeration System, the Virginia Department of Health, the Environmental Protection Agency, the U.S. Department of Agriculture, Ookla open speed-test data, and others. Nothing about a source is hardcoded in the pipeline code. -
Ingest into one schema
An ingest step fetches the source and transforms it into a long-format table with one row per geographic unit, year, and measure. Output files are compressed CSVs whose names encode coverage, geographic levels, source, years, and topic, so a file is self-describing before it is opened:
va_hdcttrbg_census_acs_2017_2024_household_broadband.csv.xzcovers Virginia at health district, county, tract, and block group levels, from the ACS, for 2017 through 2024. -
Standardize geographies
Census boundaries changed between the 2010 and 2020 censuses, which makes naive time series across that break misleading. Every dataset is placed on 2020 boundaries. Values collected on 2010 boundaries are redistributed with sdc-census10to20, and measures carry a
_geo20suffix, with a_geo10variant preserved for comparison. sdc-redistribute moves estimates into local shapes such as civic associations and planning districts; sdc-catchment turns facility locations and drive times into population-aware access scores. -
Prepare for the dashboards
A prepare step aggregates block-group and tract values up to county and health district, then reshapes the result into one wide file per geographic level for each dashboard. The two dashboards share one data format, so a measure added for Virginia is available in the same shape for the National Capital Region.
-
Describe every measure
Each pipeline ships a
measure_info.jsonwith, for every measure, a short and long description, the source and its citation, units, and provenance. This is what the dashboards show in their information panels, and it is what makes a dataset assessable before it is downloaded. -
Validate and version
New or converted pipelines are compared against reference output and the comparison is written up in a validation report in the repository. Datasets are versioned semantically, and releases are archived to Zenodo so that any version can be cited with a DOI.
The schema every file shares
| Column | Meaning |
|---|---|
geoid |
Census FIPS code of the geography (block group, tract, county, or health district) |
year |
The year the value describes |
measure |
The measure name |
value |
The estimate |
moe |
Margin of error, when the source publishes one |
data_method |
How the value was produced: observed, modeled, simulated, scaled, interpolated, or extrapolated |
What is covered
The full list of measures, with the geographies and years each one covers, is on the data inventory.